Categories
homelab

Add Unraid To Your Grafana Dashboard

In a previous post I walked through how to setup Grafana for your homelab. Grafana and InfluxDB are installed on a virtual machine and will collect the data sent from other services and machines in my homelab.

Start there if you don’t have InfluxDB and Grafana installed.

Step 1. Install HDDTemp Docker

We need to install 2 Dockers in Unraid. First, let’s add HDDTemp:

Unraid HDDTemp Docker
HDDTemp Docker in Unraid

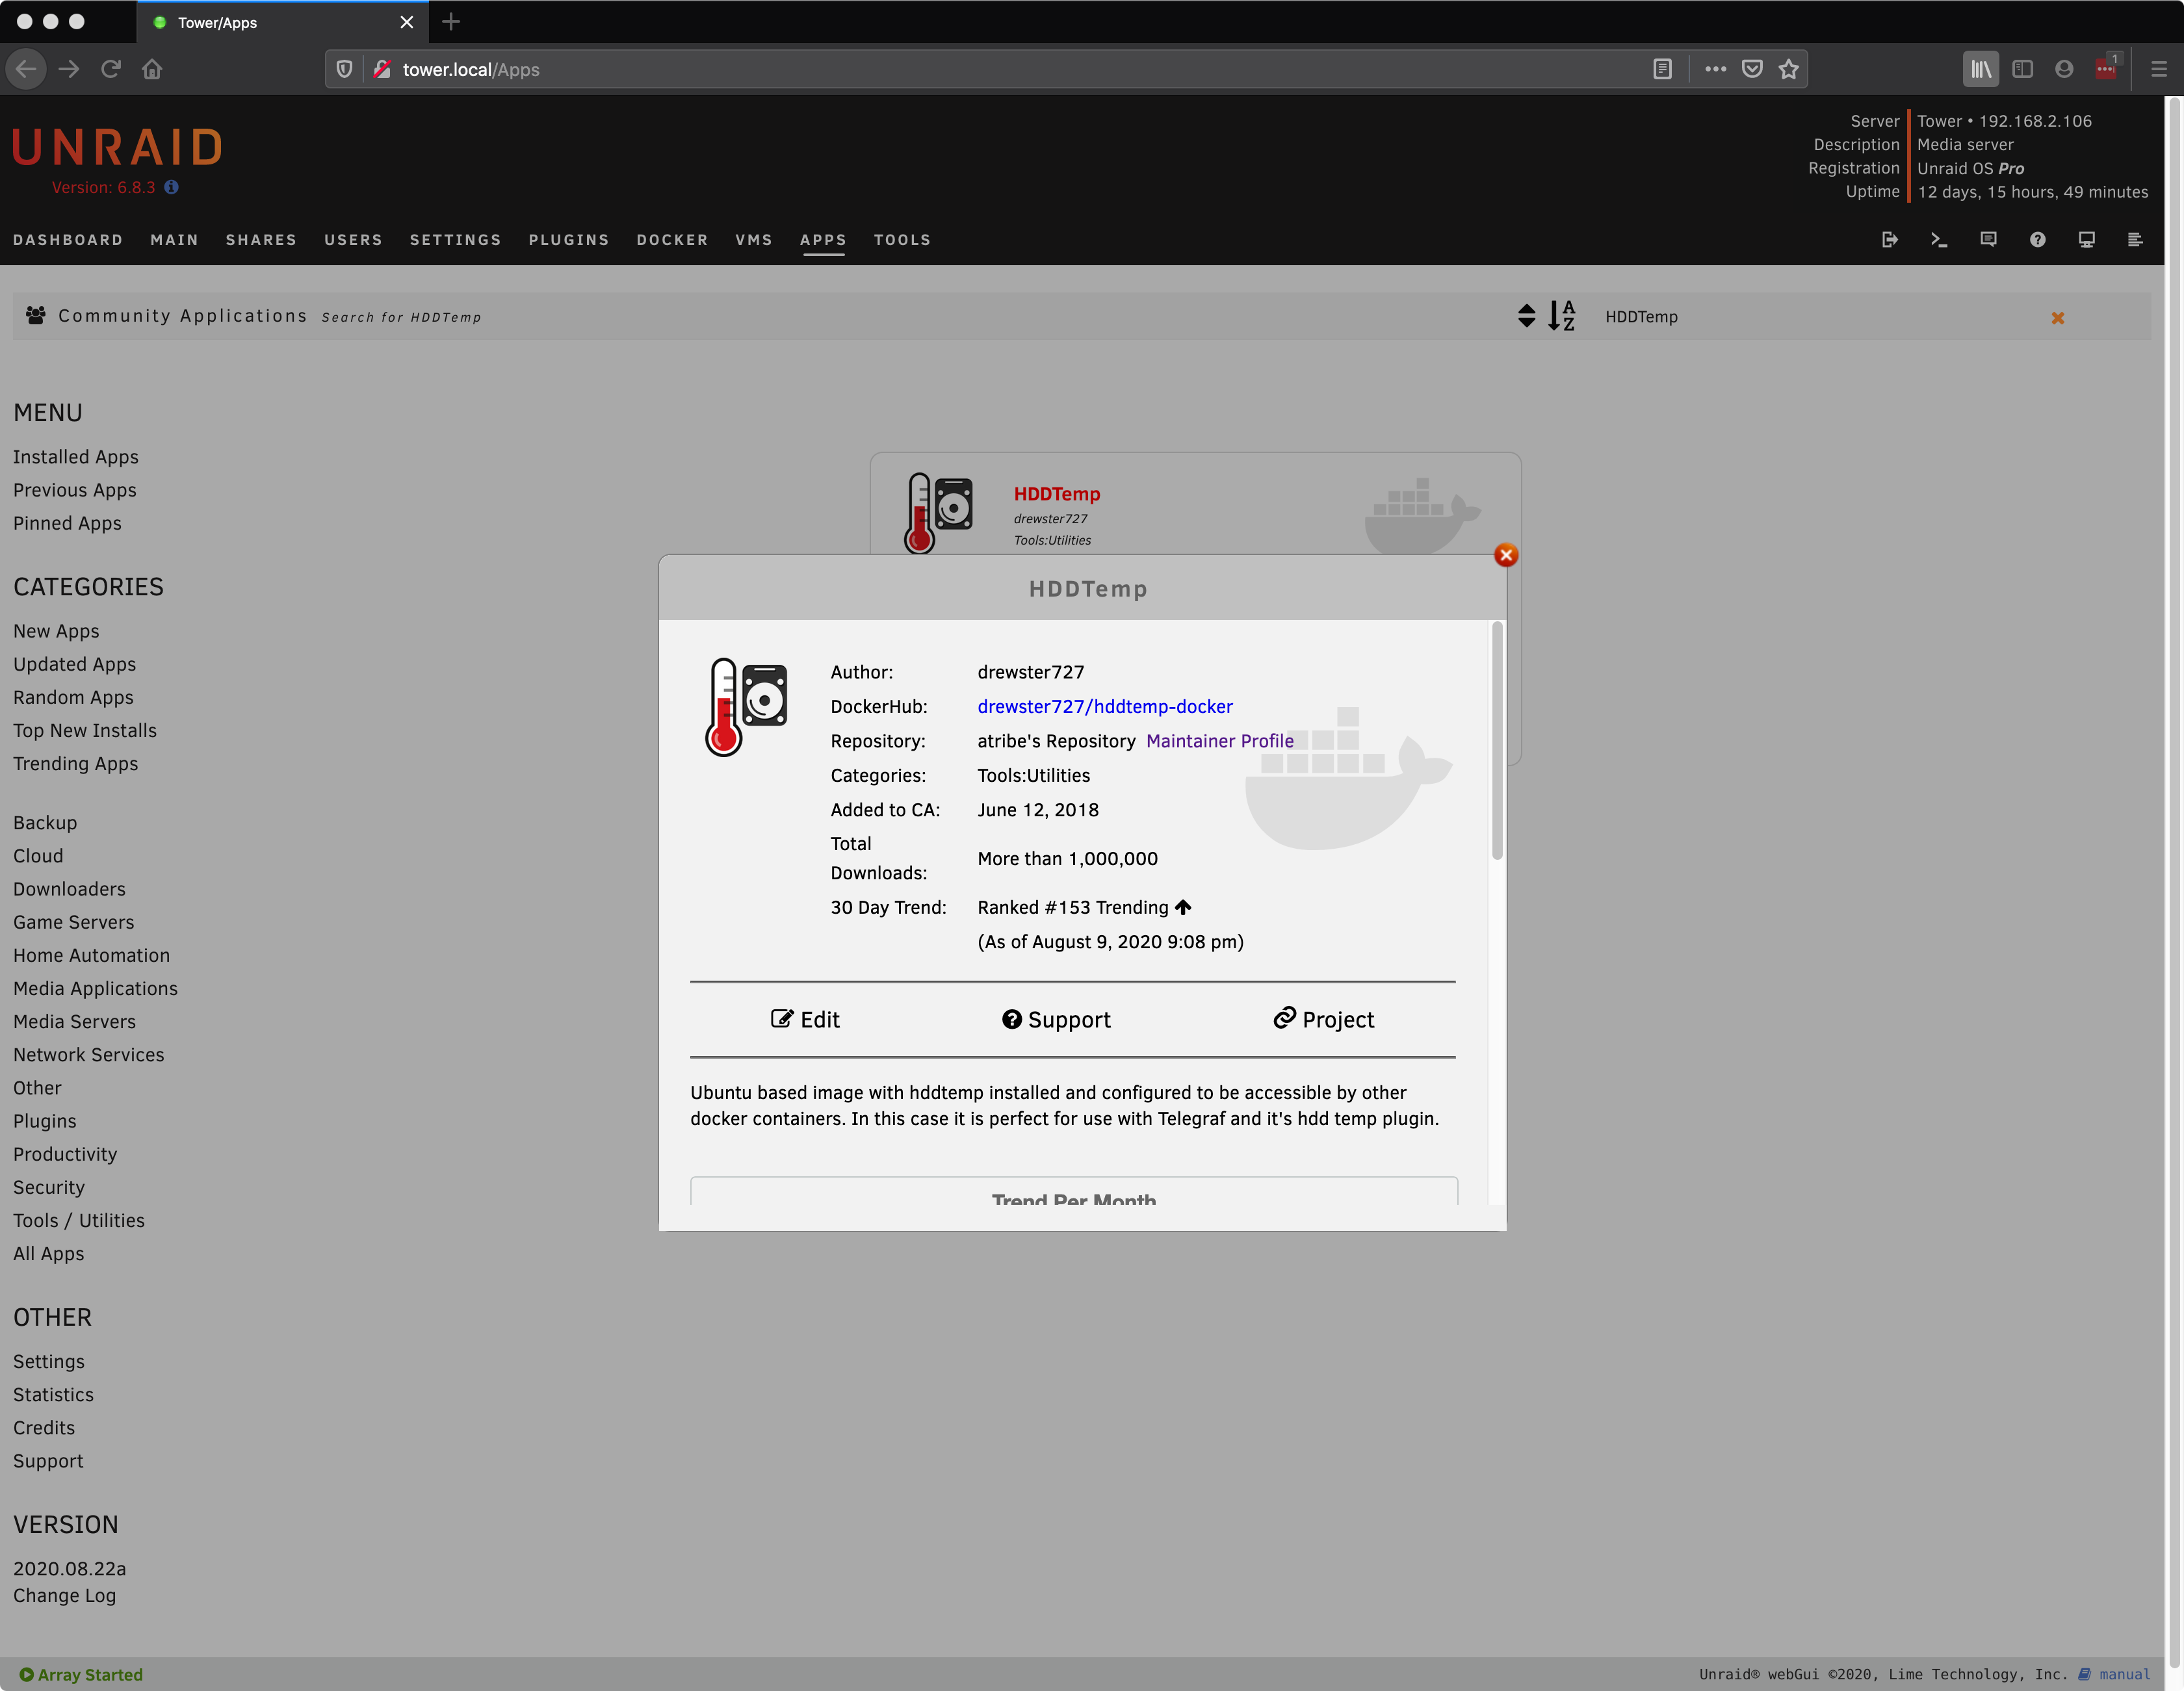
I used the default settings and clicked “Apply”.

HDDTemp Installation
HDDTemp Docker Installation

Step 2. Install Telegraf Docker

Next, install the Telegraf docker (choose the one with the green thumb):

Telegraf Docker in Unraid
Telegraf docker in Unraid

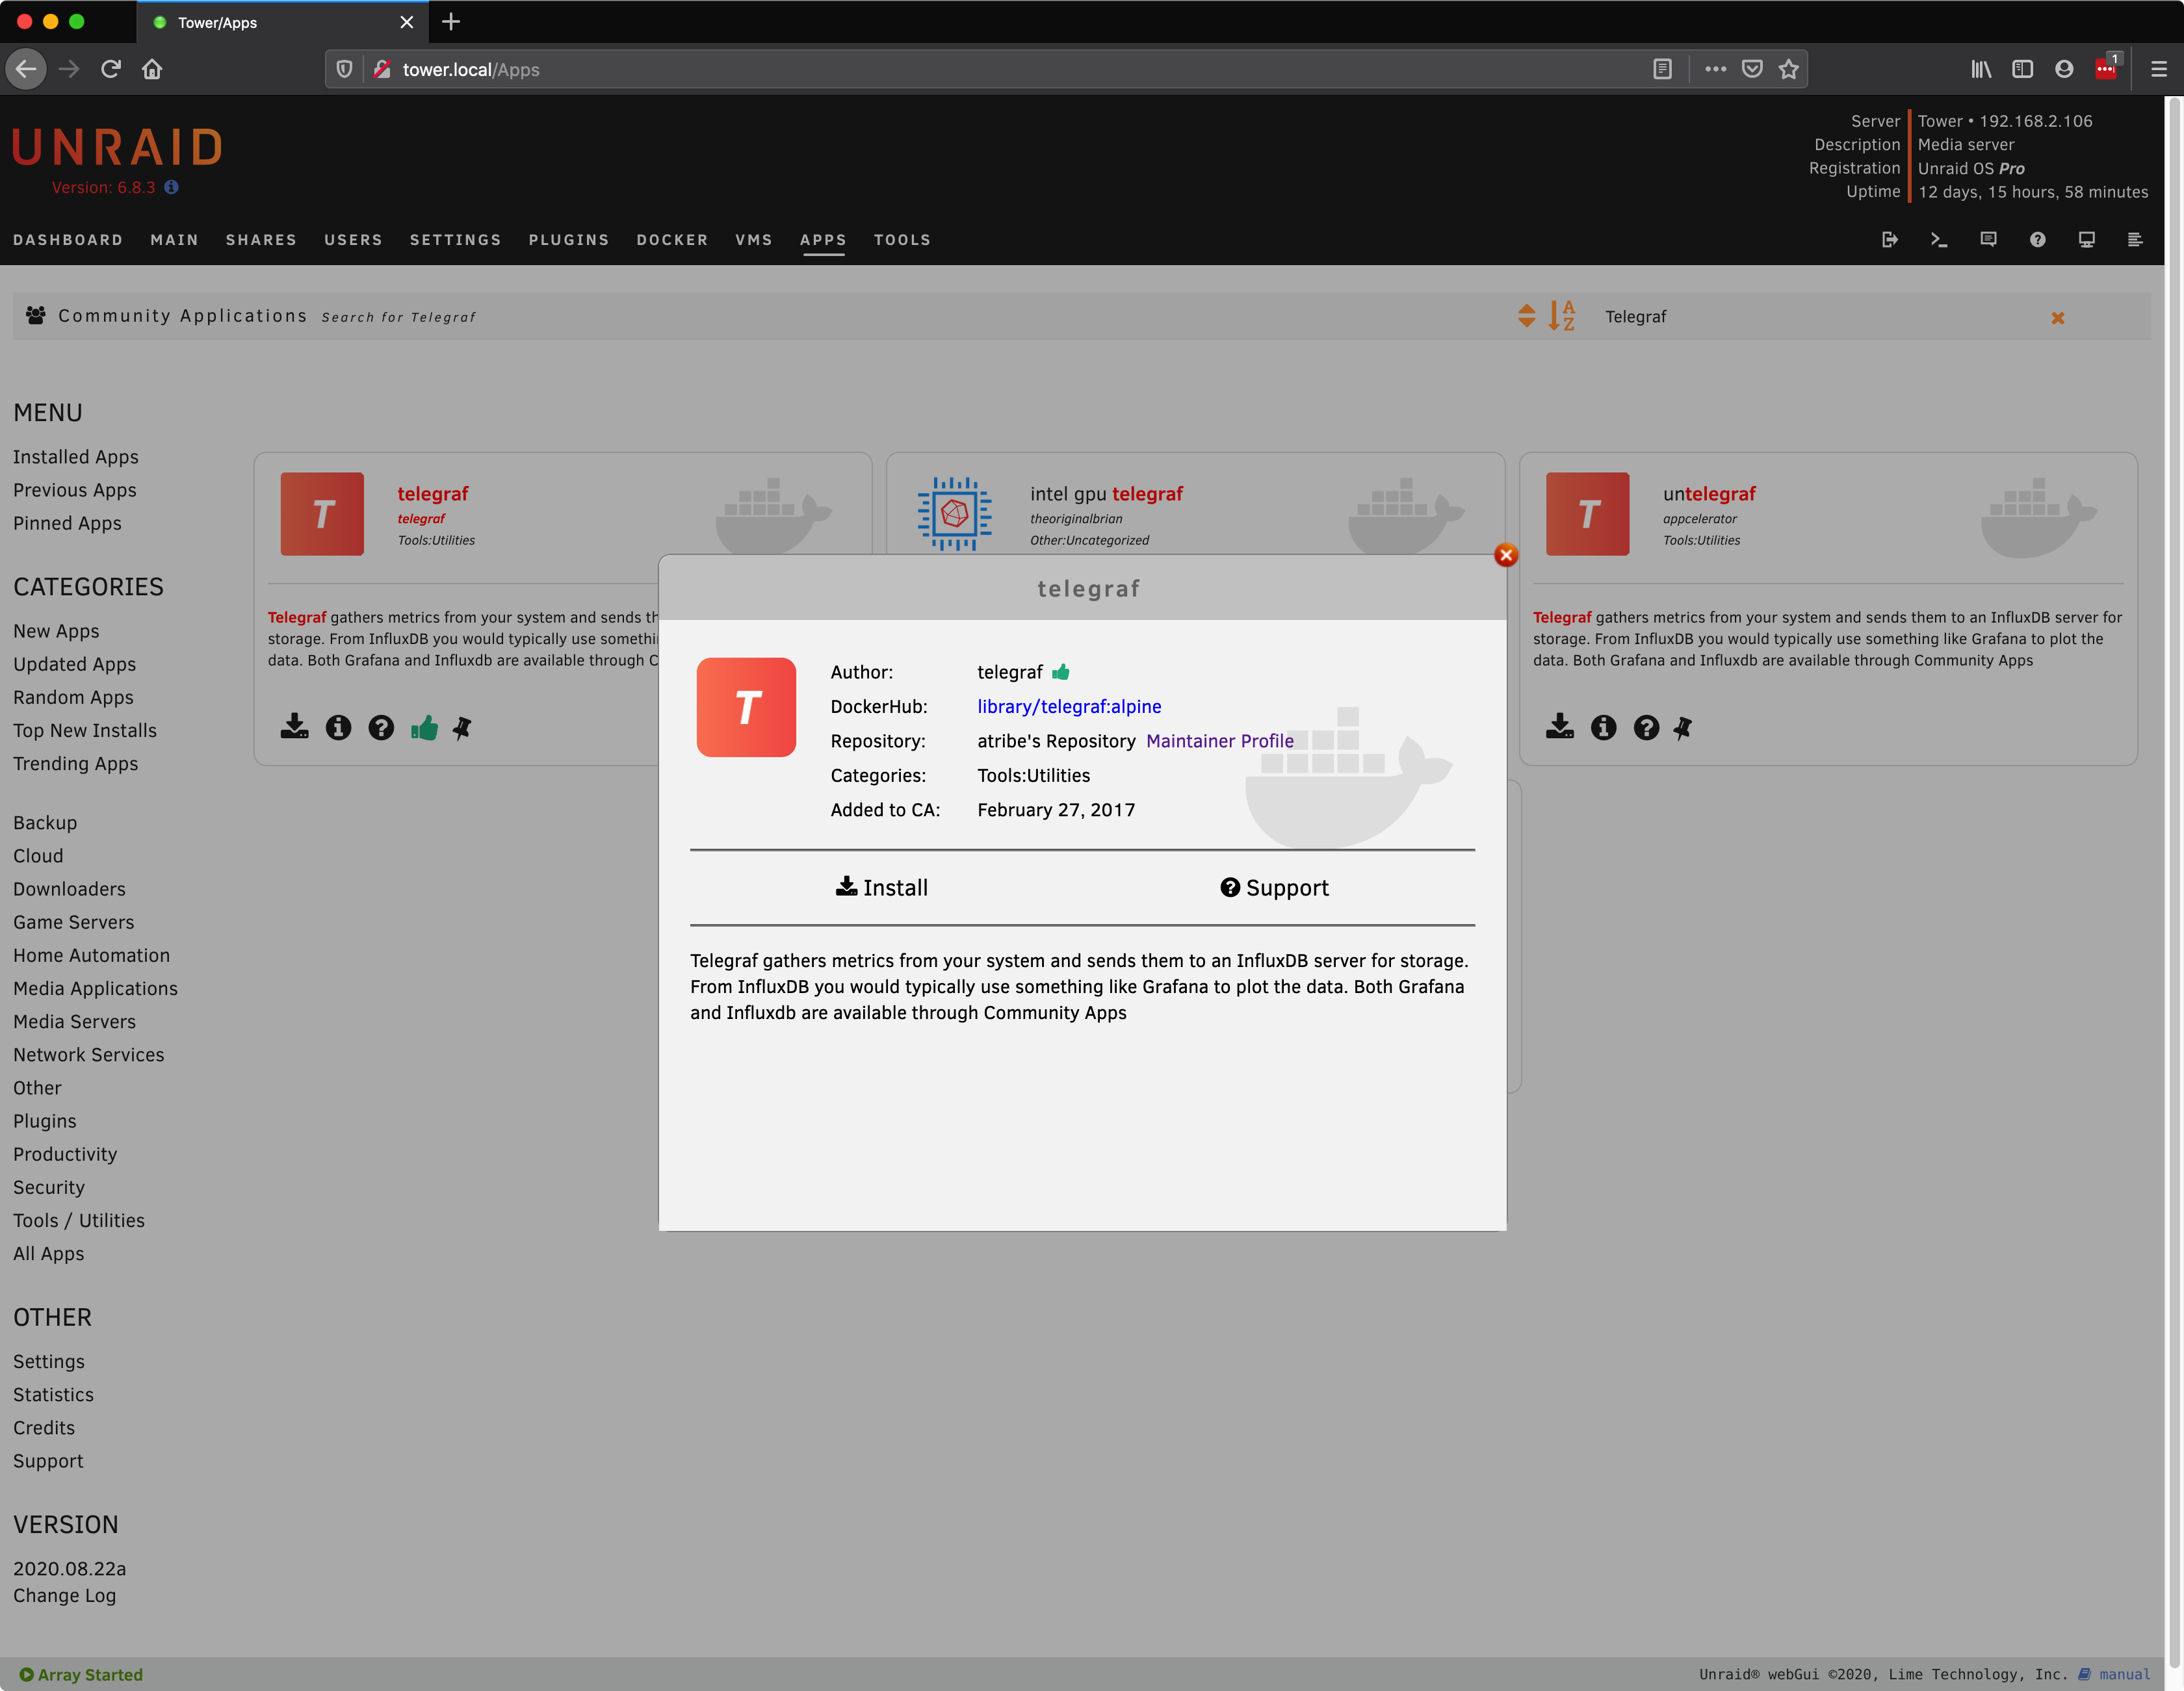
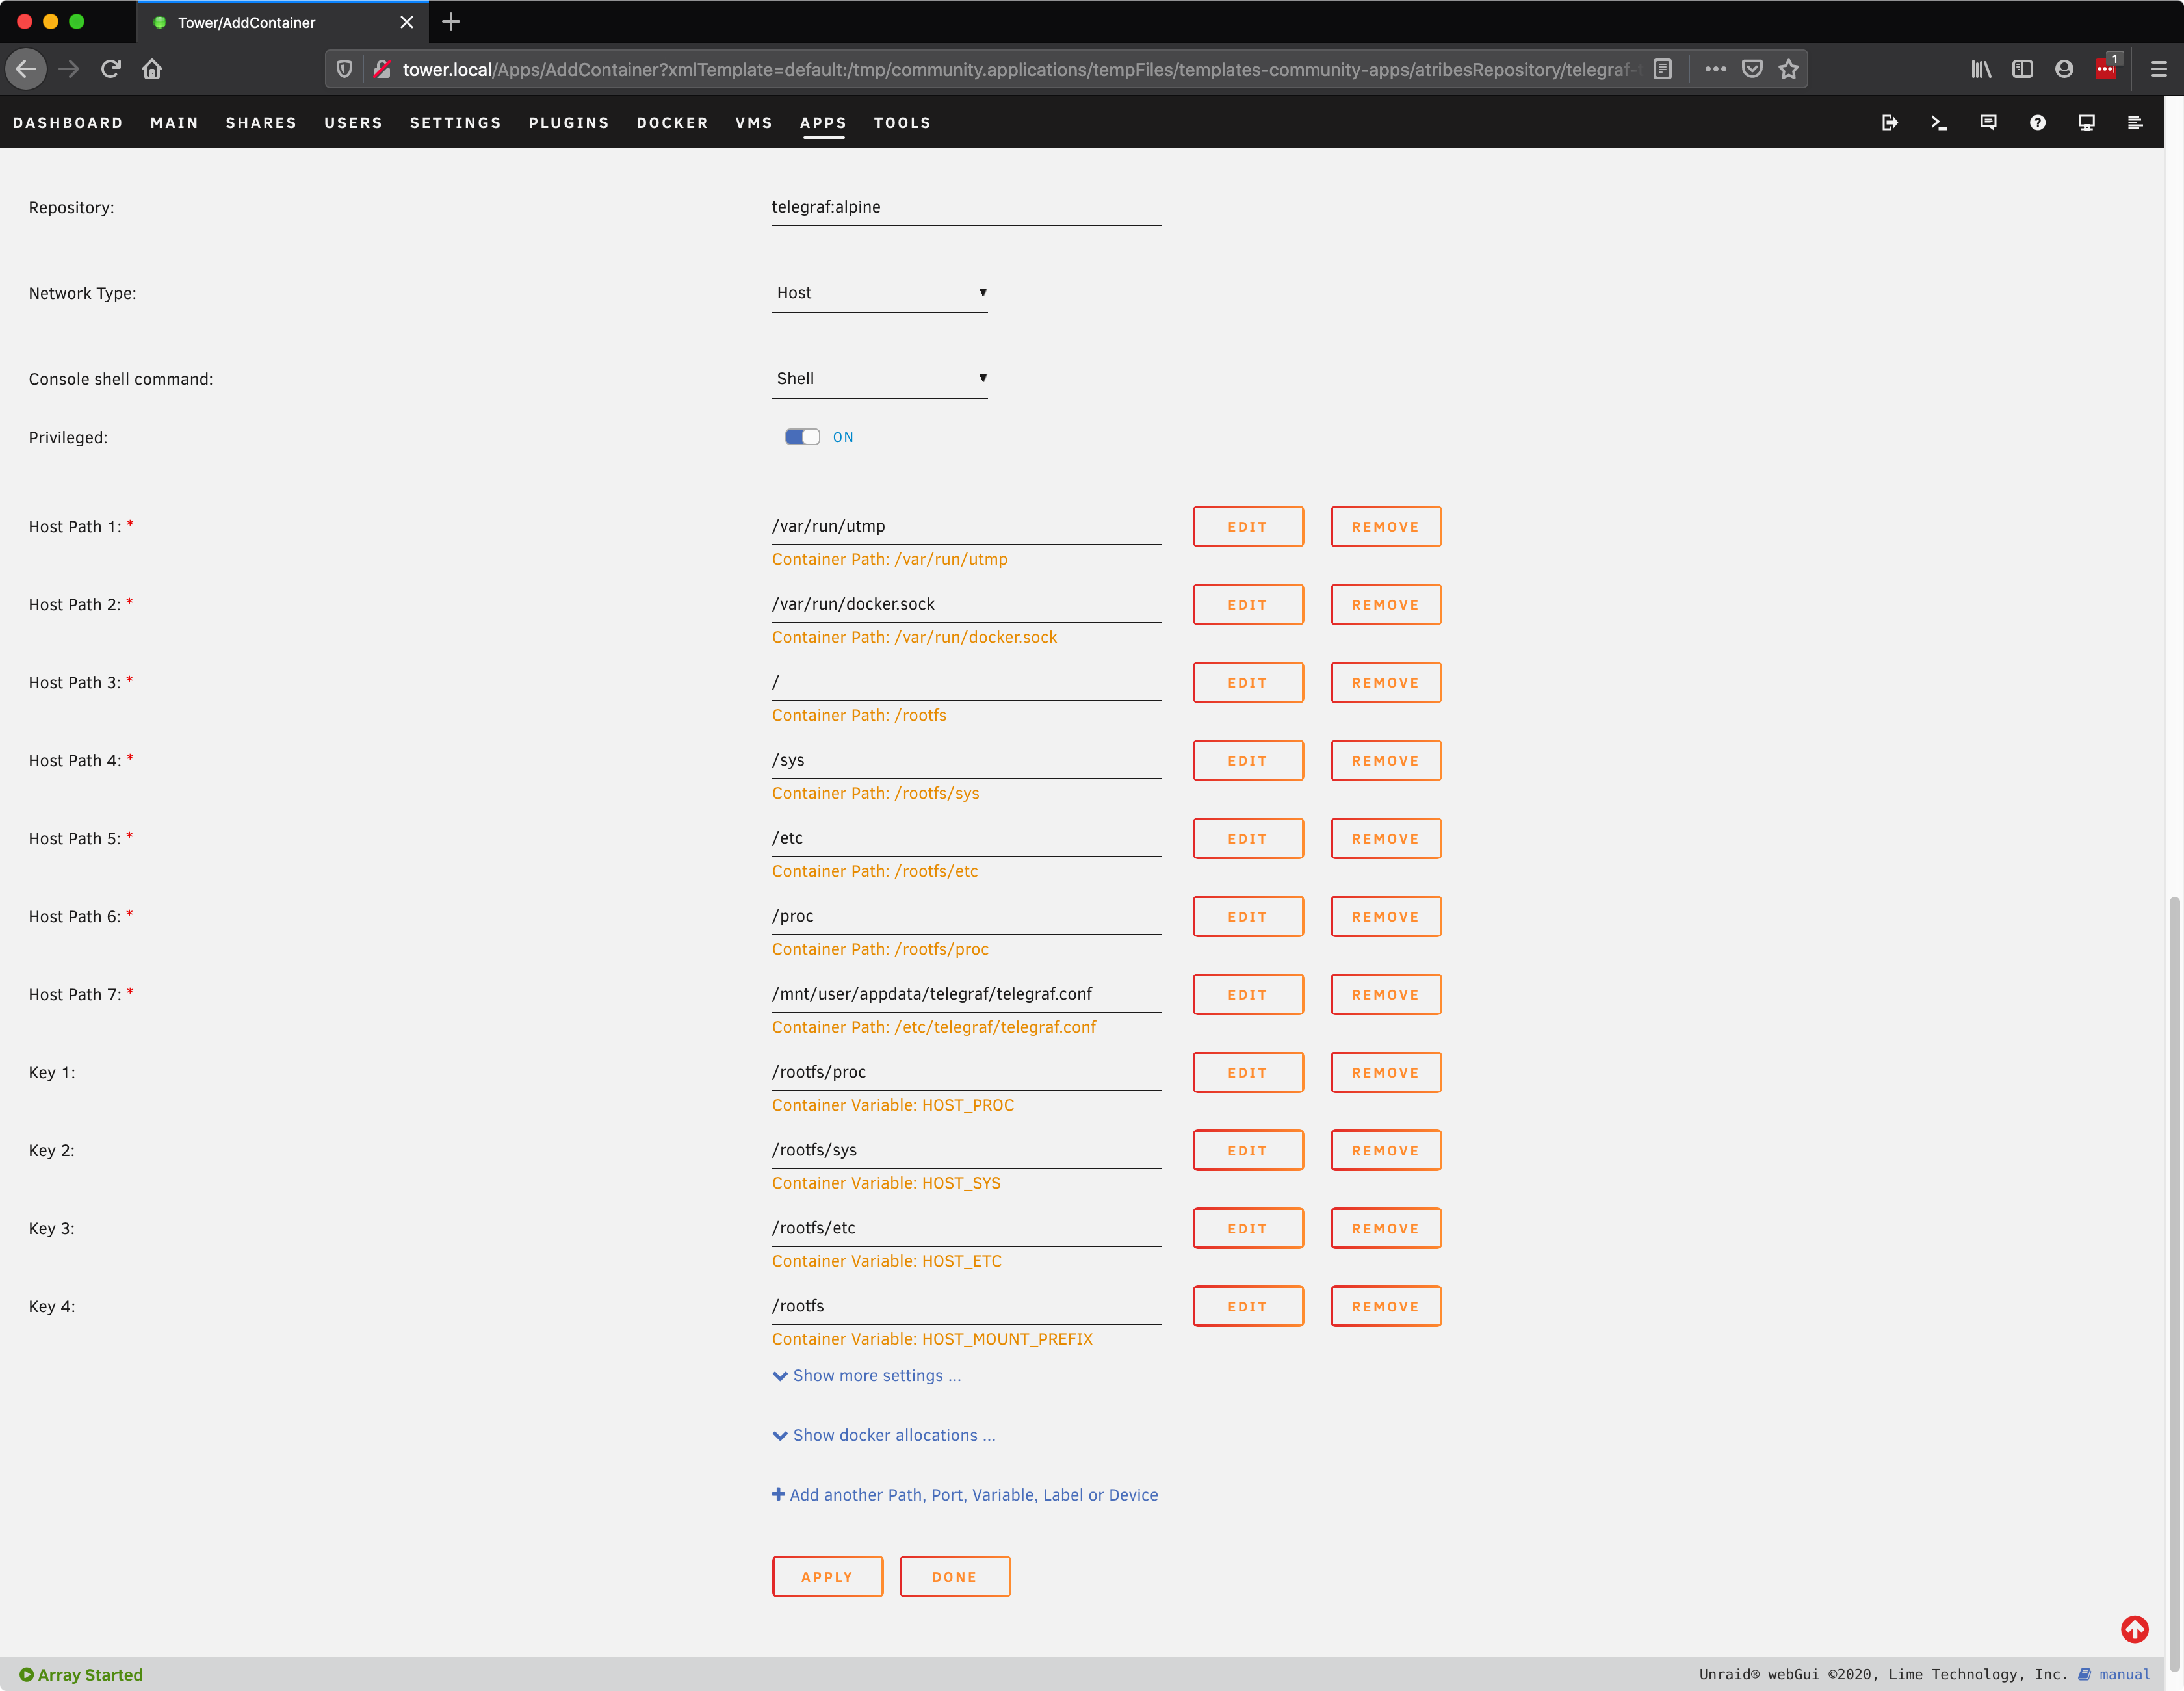
I’m also going to leave the default settings for the Telegraf installation:

Telegraf docker installation

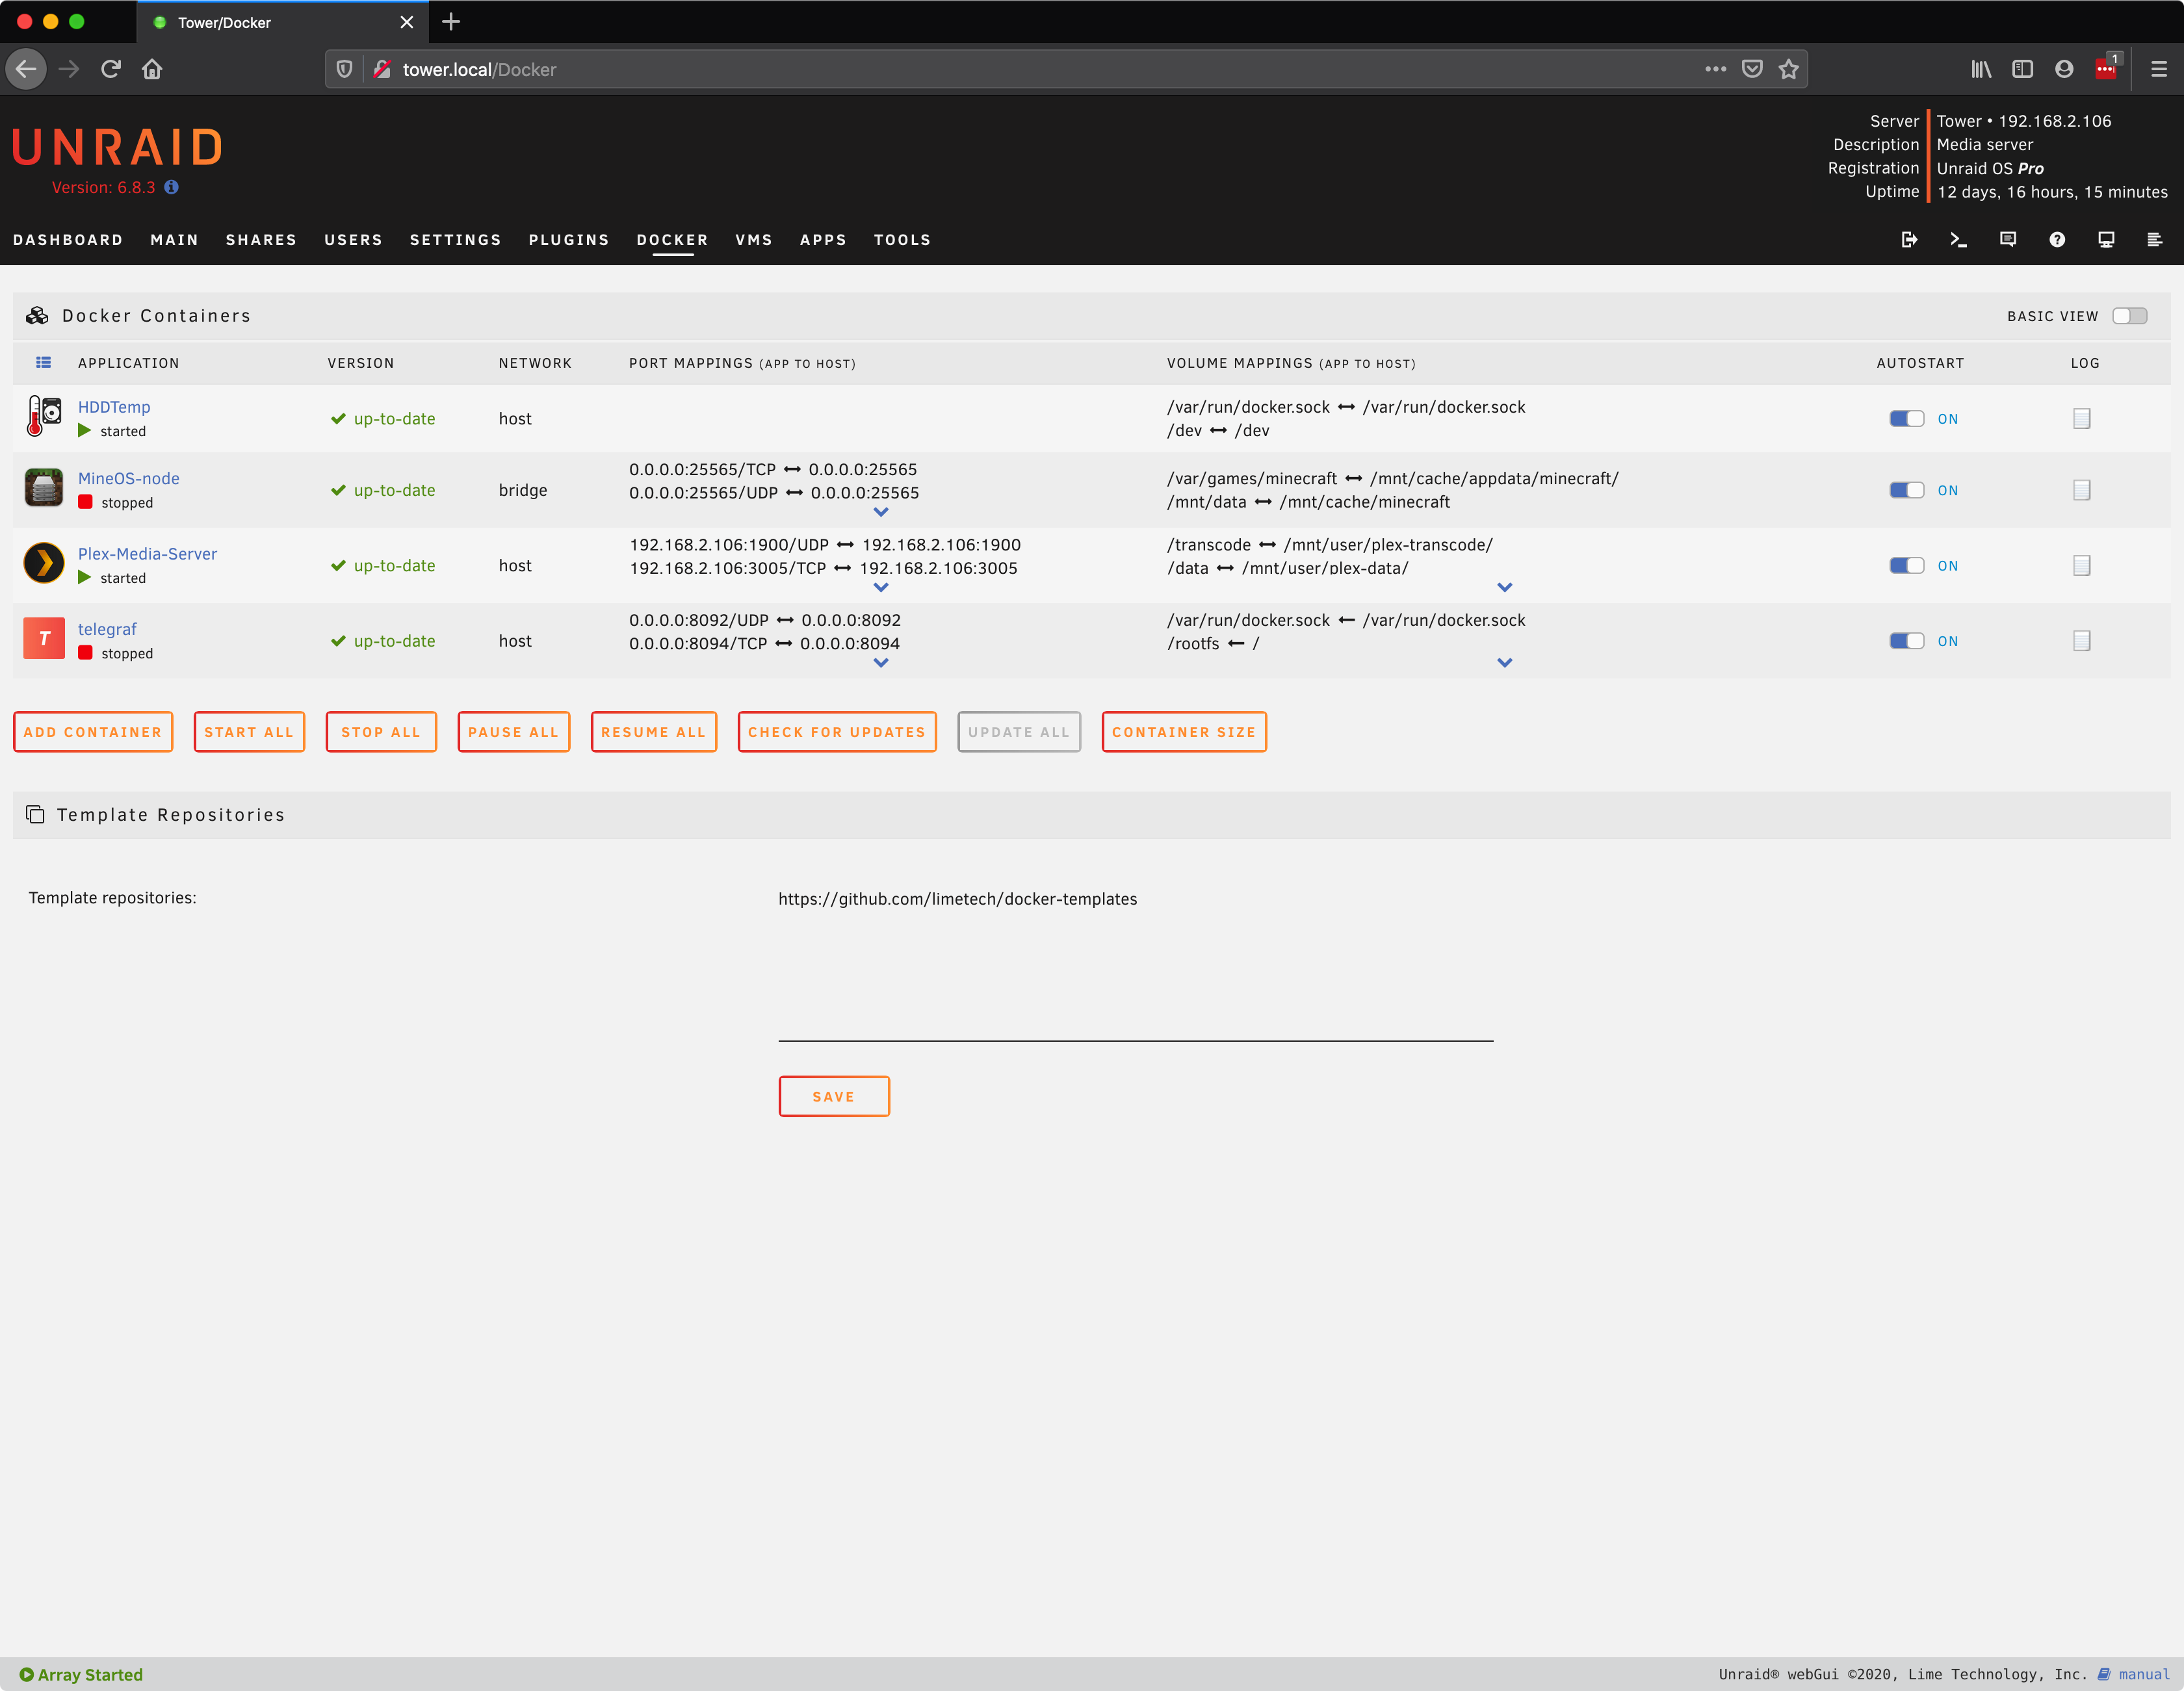
You should see both docker containers under the docker section in Unraid:

HDDTemp and Telegraf dokcers in Unraid

Step 3. Setup Telegraf

We need to manually add the Telegraf configuration file before we can start Telegraf. The default file is located here: https://github.com/influxdata/telegraf/blob/master/etc/telegraf.conf. We need to place that in the /mnt/user/appdata/telegraf/ folder. You can also specify a different location under the Telegraf docker container settings.

First, I’m deleting the telegraf.conf directory that was created during the Telegraf installation.

Note: For some reason this directory is created during install (at least for me). If you want to leave the default container settings this needs to be removed and replaced with an actual file.

I’m using the Unraid web terminal to do the following:

rm -rf /mnt/cache/appdata/telegraf/telegraf.conf

Note: If you have already run mover after you installed Telegraf, you will need to use /mnt/user/appdata/telegraf/telegraf.conf.

Get the default Telegraf file.

wget https://raw.githubusercontent.com/influxdata/telegraf/master/etc/telegraf.conf -P /mnt/cache/appdata/telegraf/

Use nano to edit the file.

nano /mnt/cache/appdata/telegraf/telegraf.conf

Change the InfluxDB settings to the location of your InfluxDB:

InfluxDB settings in Telegraf config file

Uncomment (remove the # character) from the following plugins:

[[inputs.hddtemp]]

[[inputs.net]]

[[input.sensors]]

[[input.smart]]

Ctrl+O and then hit return to write the file.

Ctrl+X to exit the file.

Run the mover.

mover

Step 4. Verify Data

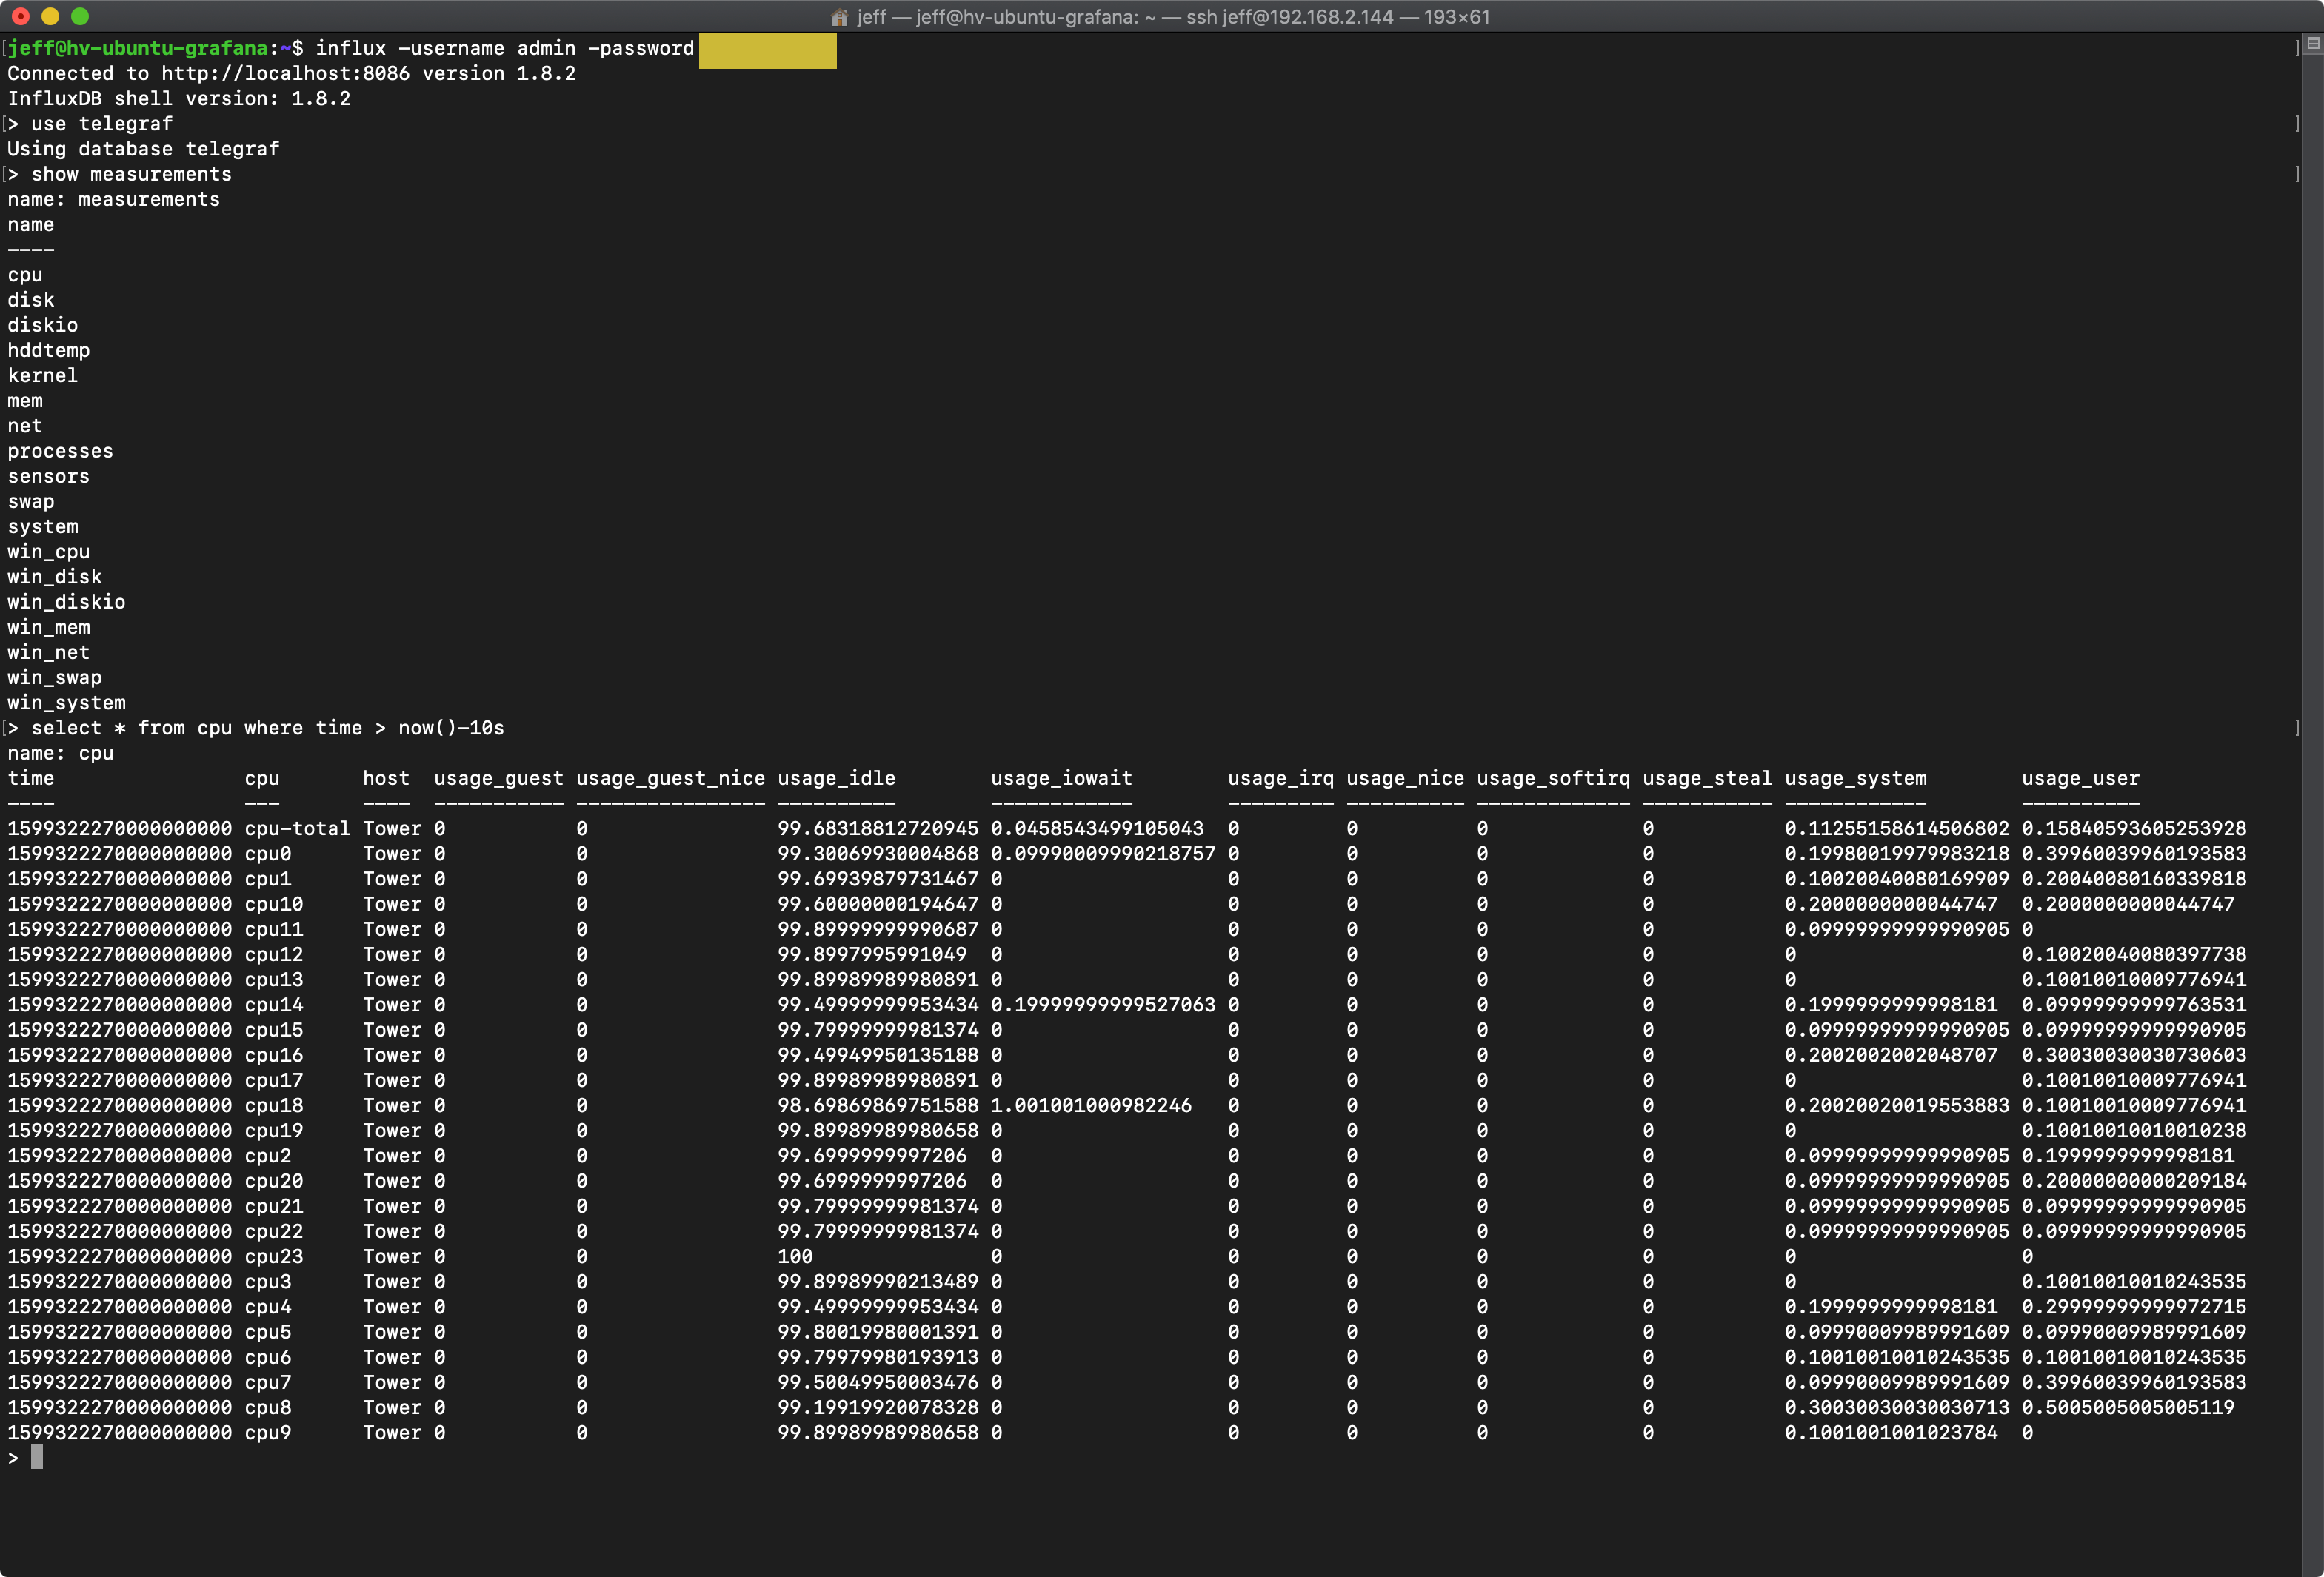
Log into the system where your InfluxDB is installed.

ssh jeff@192.168.2.144

Login to InfluxDB

influx -username admin -password YOURPASSWORD

Select the database where your Unraid data is being sent:

use telegraf
show measurements

Run a quick query to make sure you are getting data from Unraid:

select * from cpu where time > now()-10s

It should look something like this:

InfluxDB data from Unraid

Step 6. Grafana Dashboard

Login to Grafana. We’ll assume you already have a the InfluxDB data source setup. If not, add that under Configuration > Data Sources > Add data source.

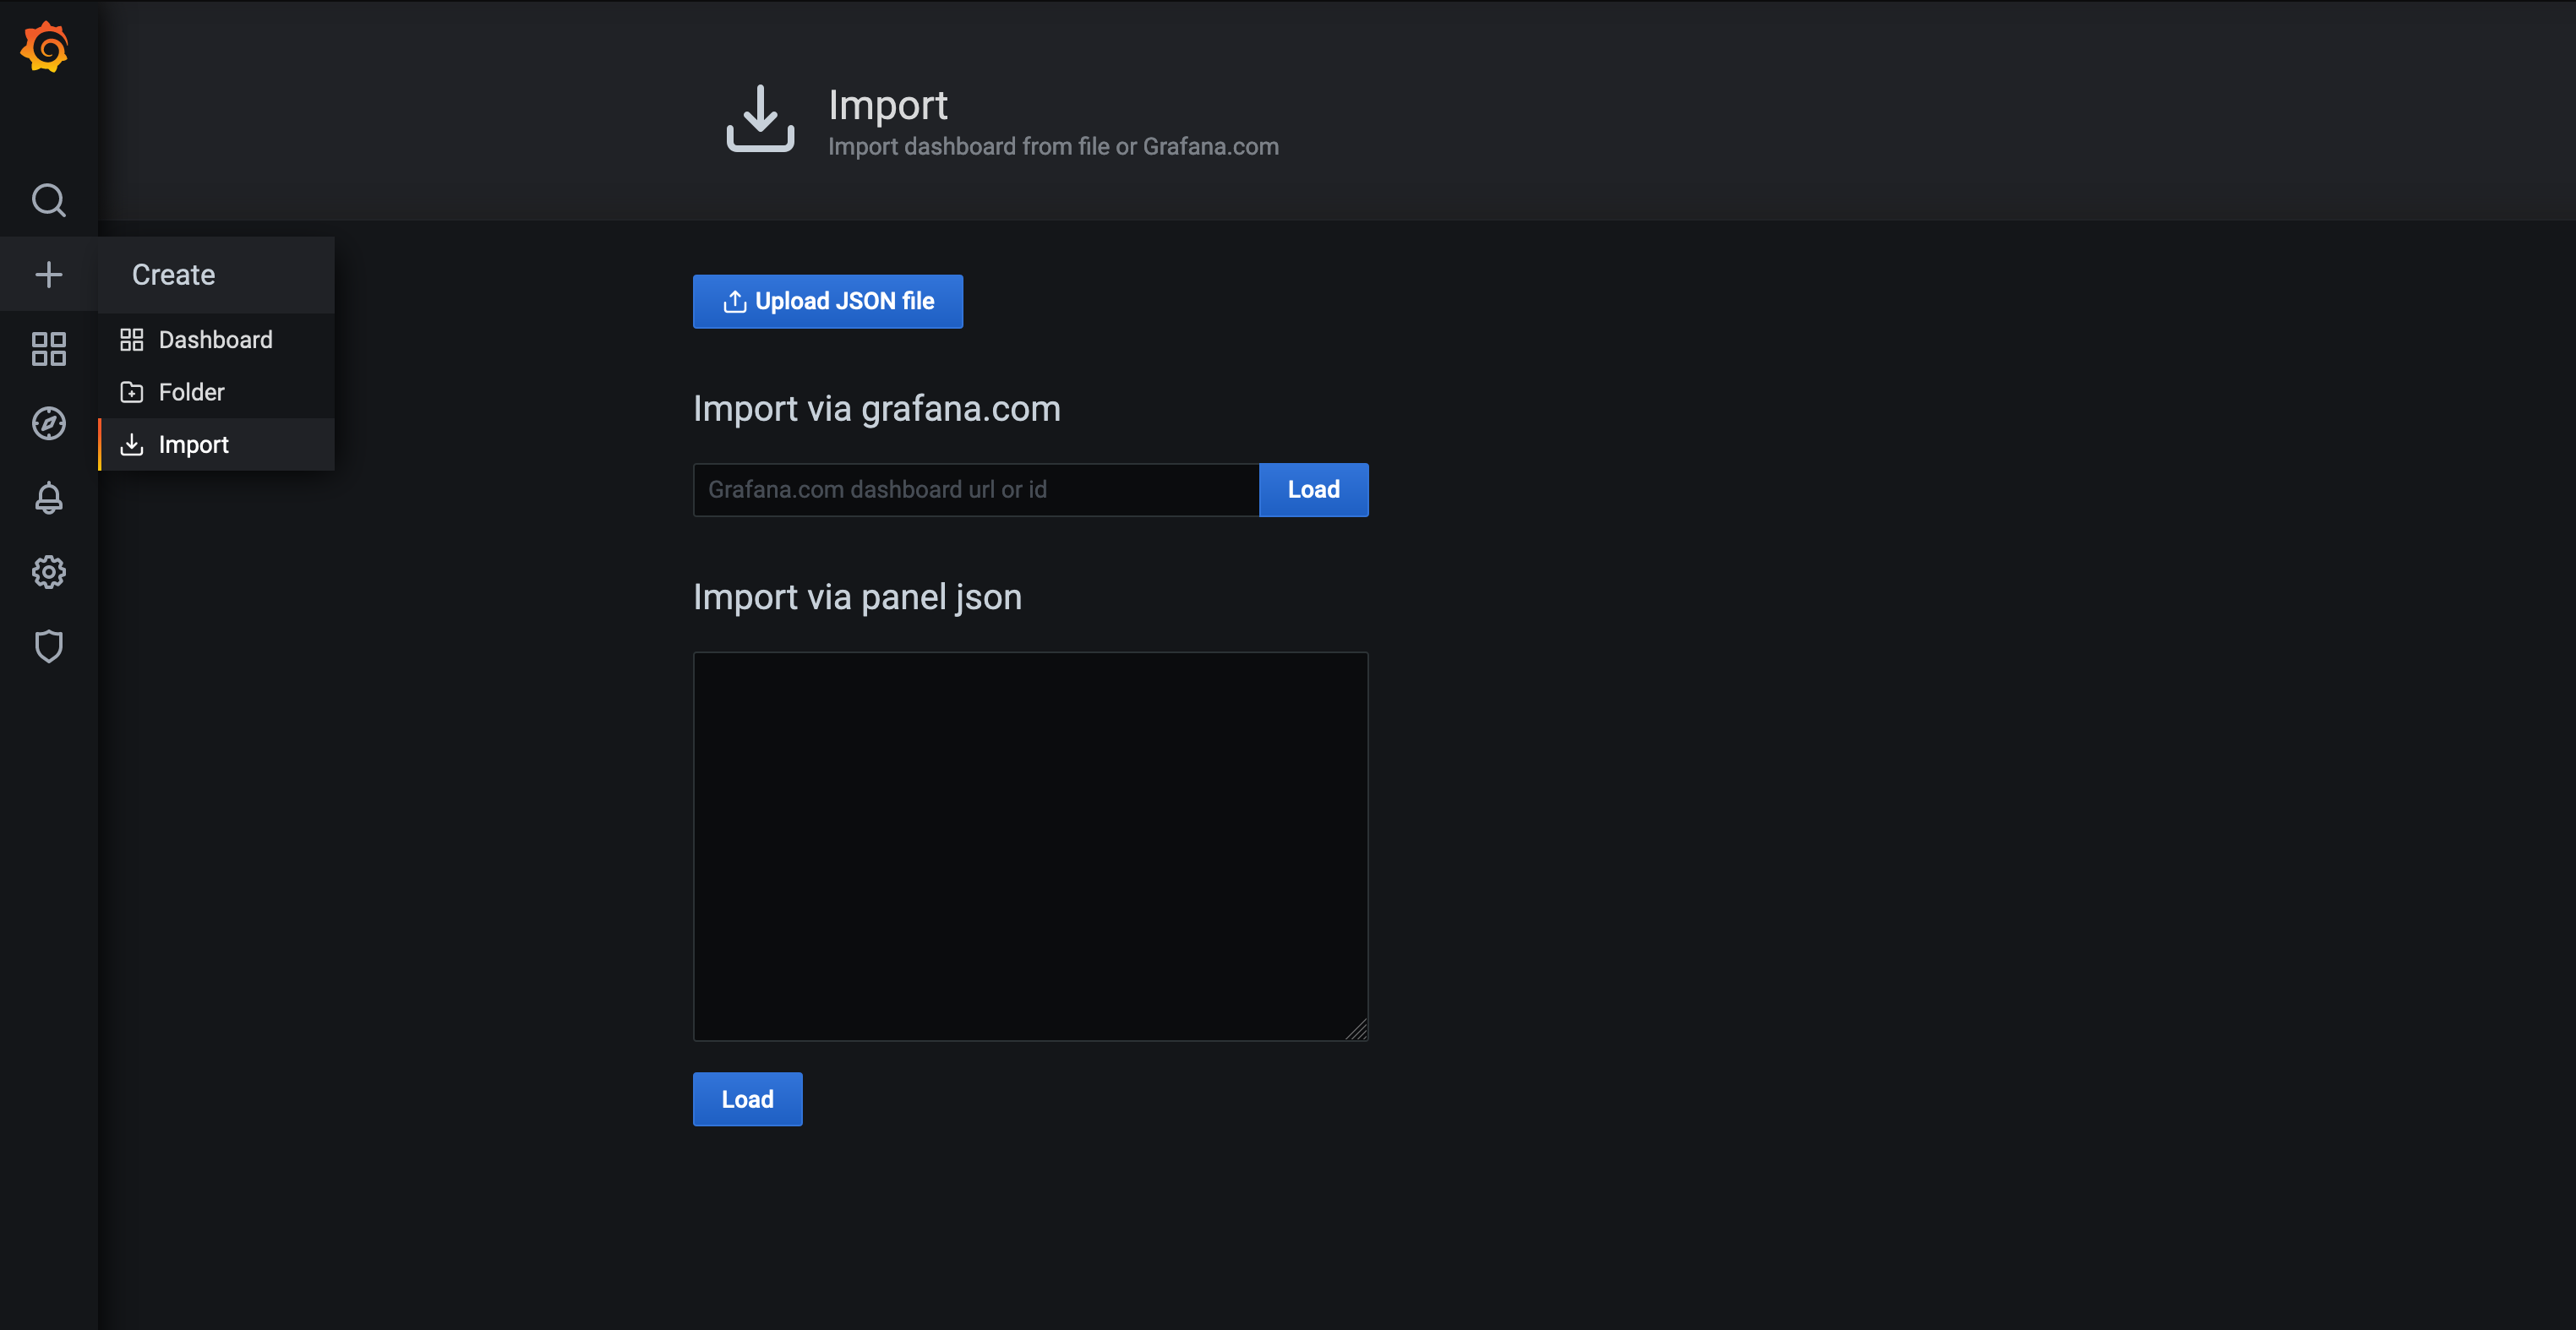
There are a number of really great dashboards that can help you get started. I recommend importing an existing dashboard to give you some ideas on how the data can be visualized in Grafana.

You can search “Unraid” here: https://grafana.com/grafana/dashboards to see what others have created.

A very robust dashboard is #7233. To import this, go to the import option in your Grafana installation and enter 7233 when asked for the dashboard ID.

Import Grafana Dashboard

Notes.

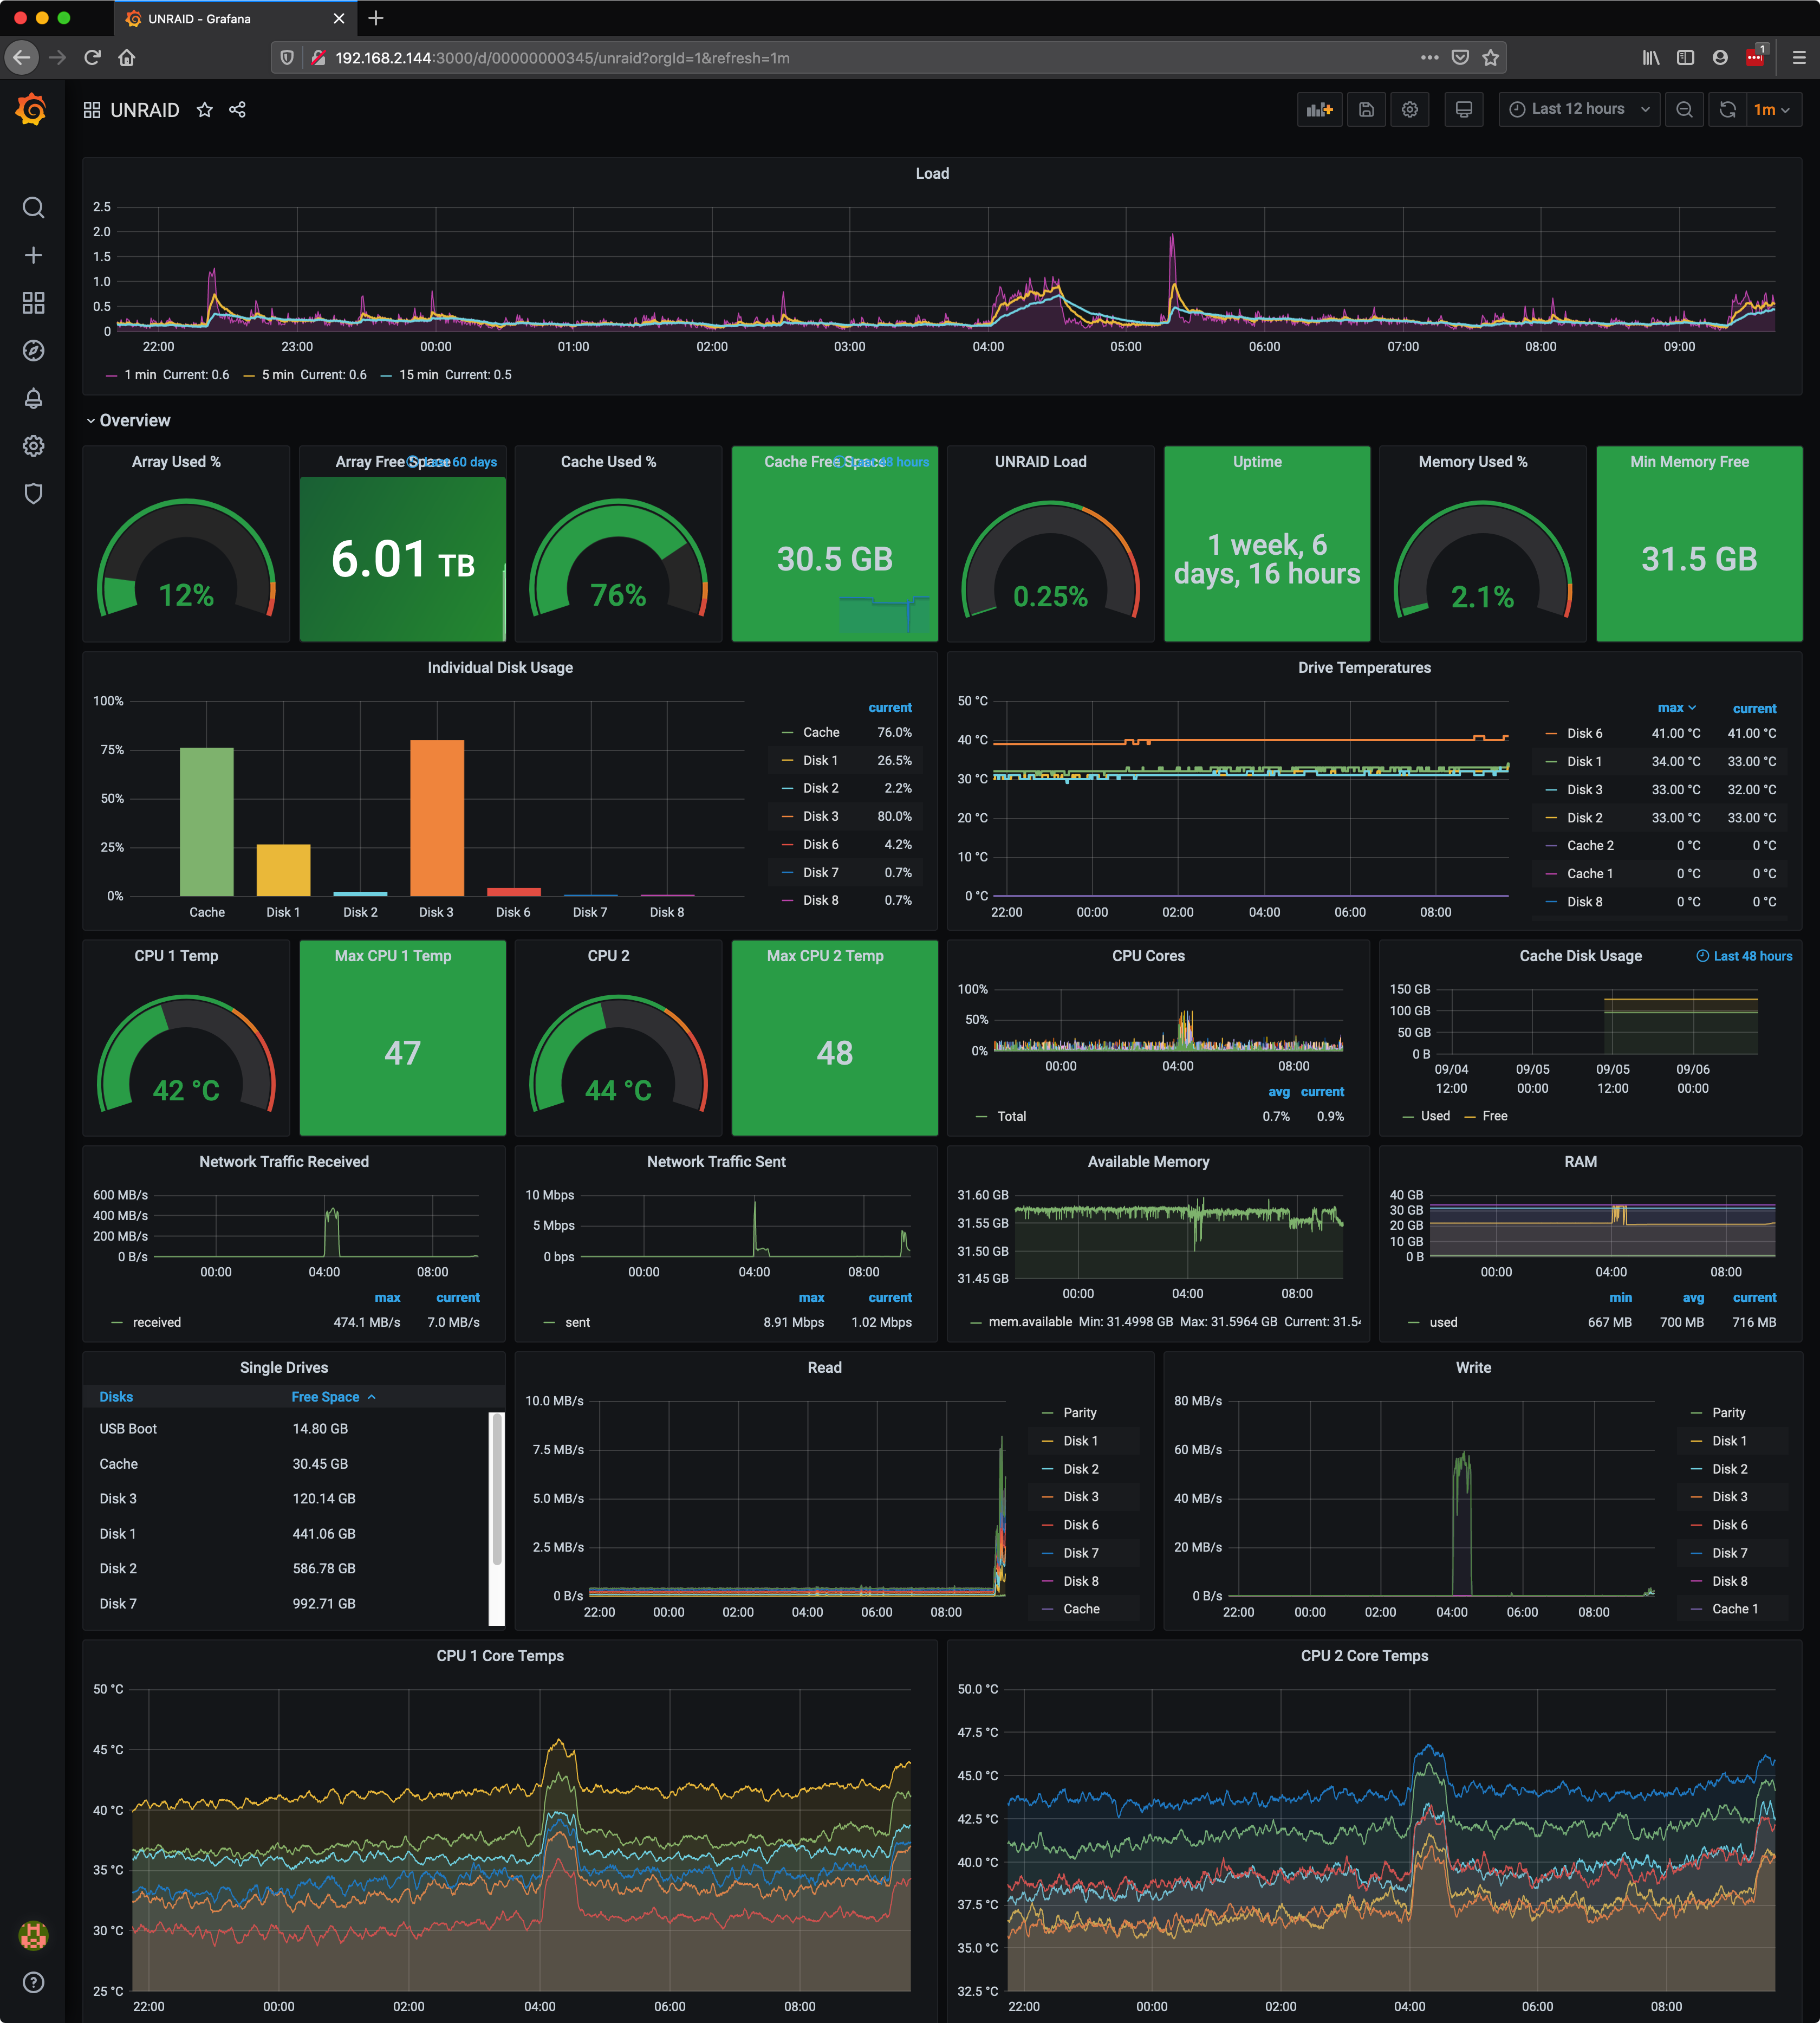
My current Grafana dashboard for Unraid looks like this:
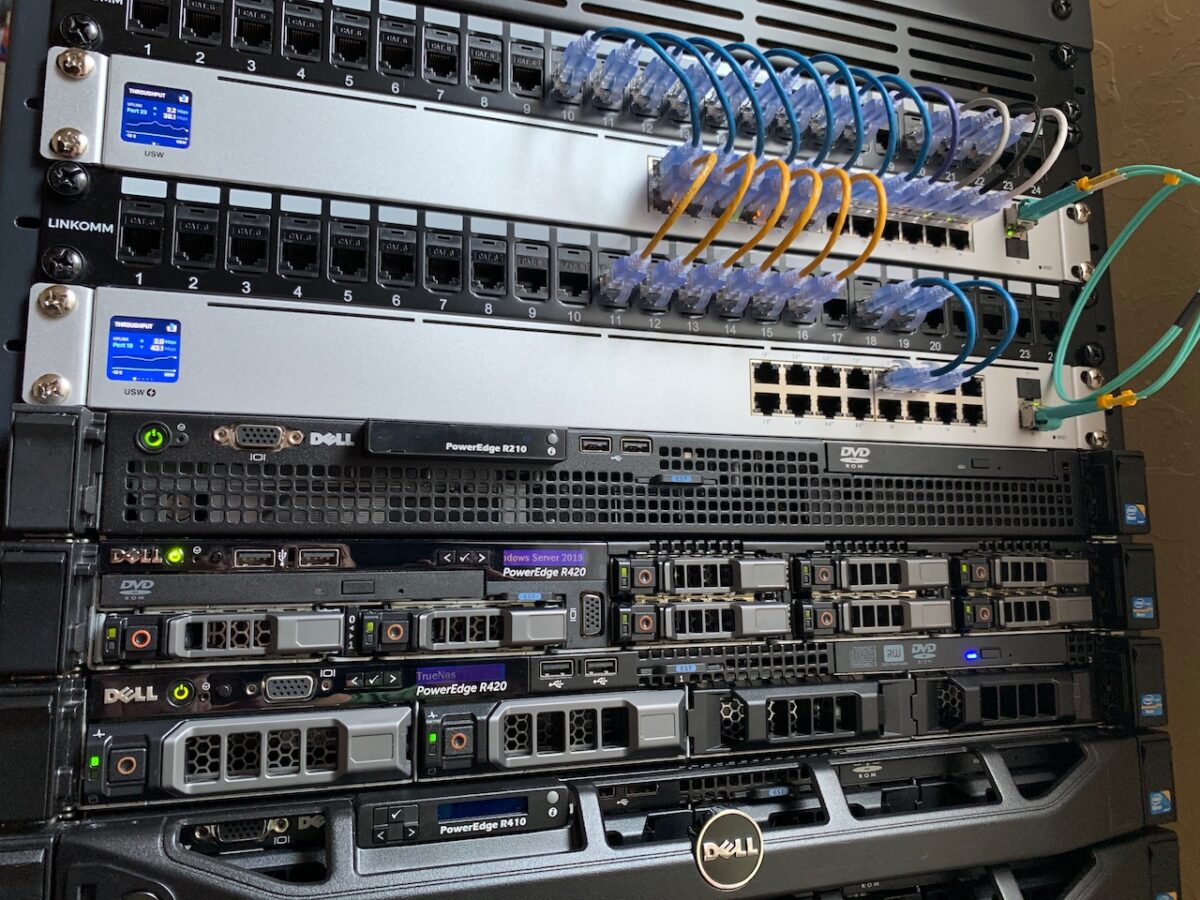
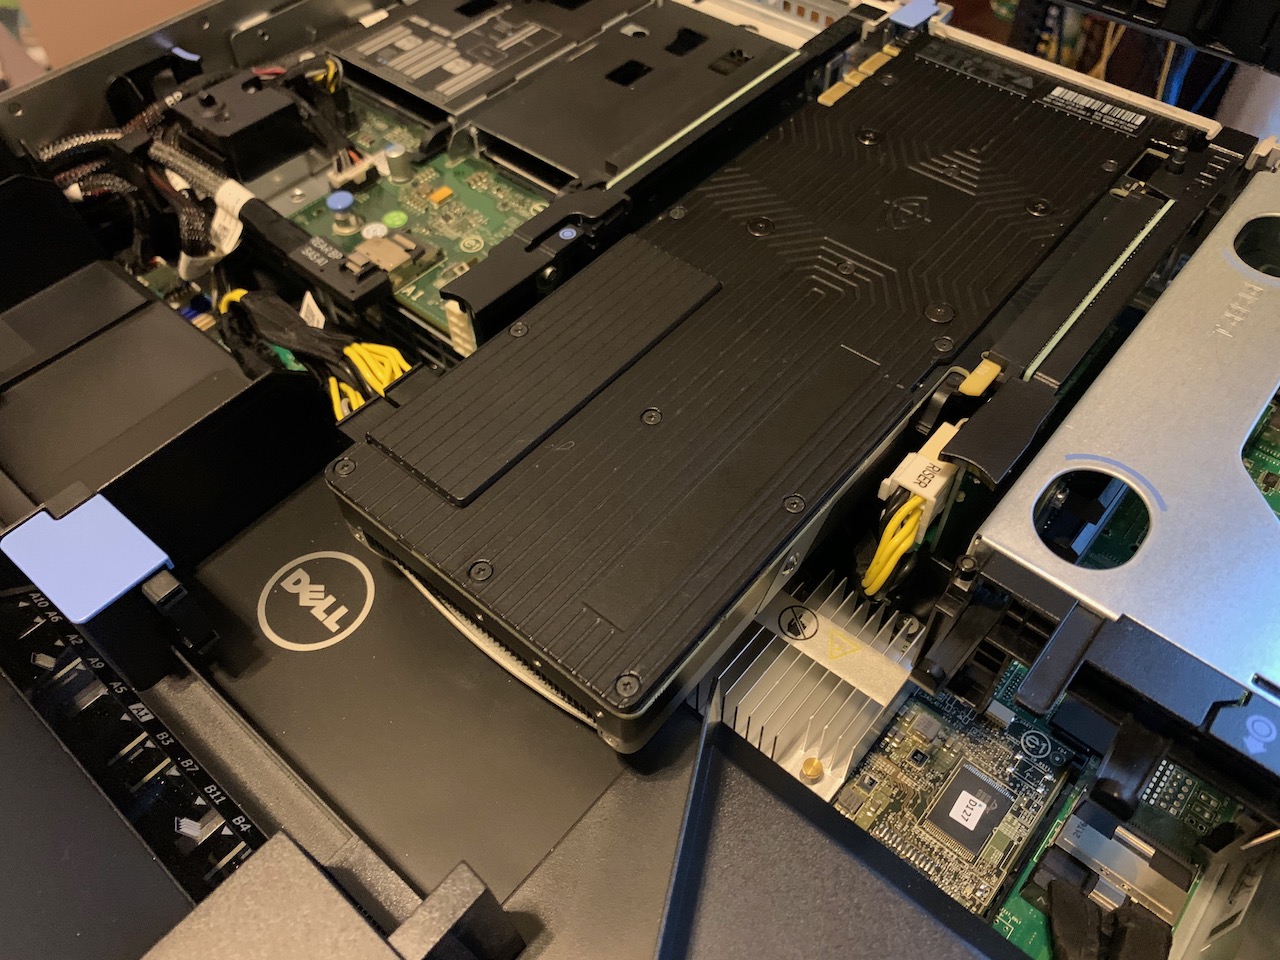
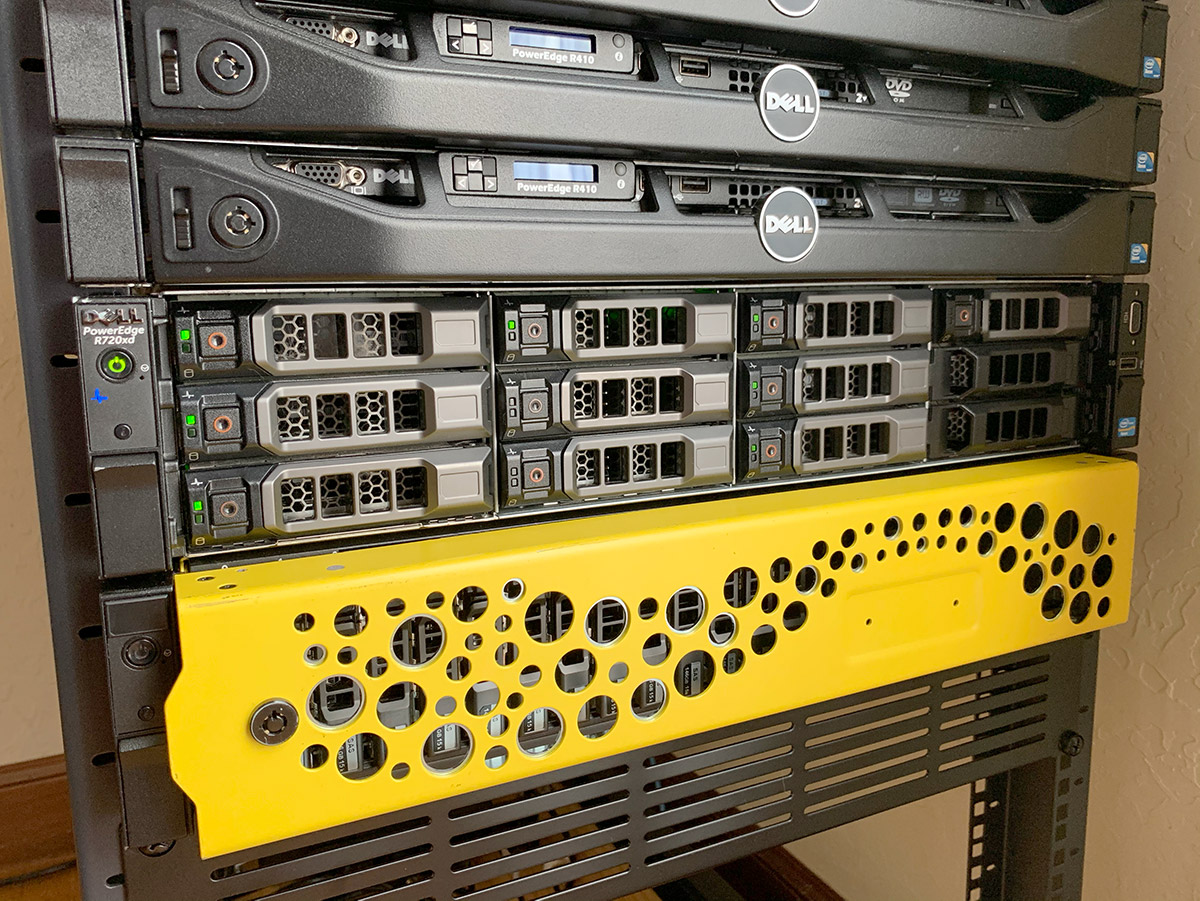
Grafana dashboard for Unraid

Unraid Server

My current Unraid server configuration consists of a Dell r720xd with an assortment of mixed size drives:

Dell r720xd LFF (12 x 3.5 hdd bays, 2 x 2.5 flex bay)
Intel Xeon E5-2620 (x2)
1100W Power Supplies
32GB DDR3 Memory
Dell Perc H310 Mini
Parity Drive: 3TB Dell SAS 3.5 HDD
Storage Array: 6 x 2.5 & 3.5 Dell SAS HDDs (600GB-3TB)
Cache Drives: 2 x Samsung 850 Pro SSD 120GB (flex bay)
16GB USB Flash Drive (boot drive)
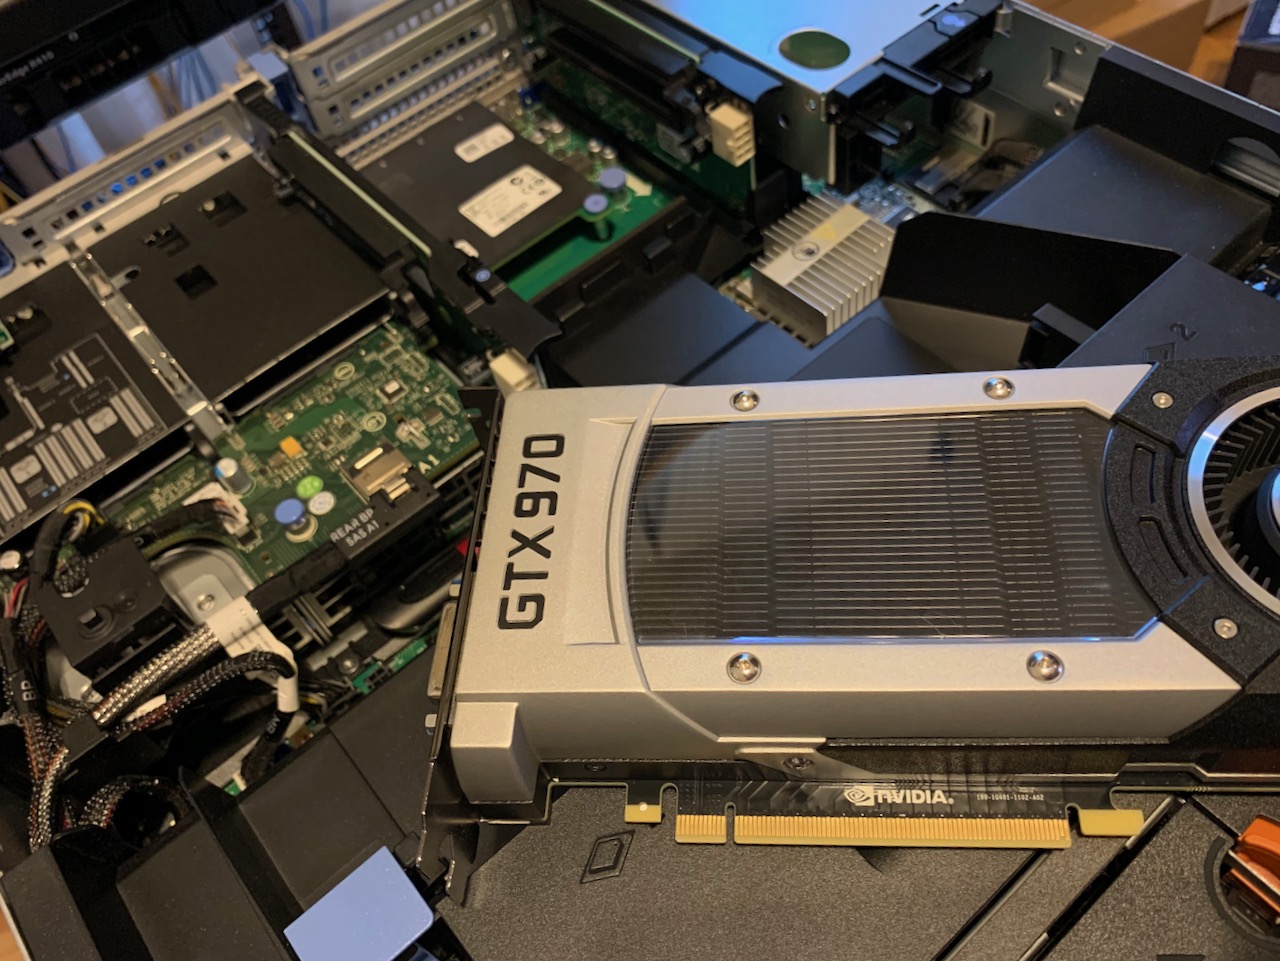
Nvidia GTX 970 Founders Edition

Categories
homelab

How to monitor CPU temperature when using Untangle Firewall

So, you fired up your shiny new Untangle firewall and quickly realized there is no CPU temperature reading. For the tinkering type like me who cobbled together a mix of noctua fans and old enterprise hardware, a simple CPU temperature reading is a must.

Step 1. Turn on SSH

The first thing we need to do is turn on SSH in the Untangle control panel. Open a browser and enter the address of your Untangle installation.

Once logged in, go to Config > Network > Advanced > Access Rules and check the box under Enable on the “Allow SSH” line.

Click “Save” in the bottom right corner of the page.

Untangle Access Rules

Step 2. SSH login

Open Terminal or your favorite command line tool and login to Untangle. Replace the IP address below with your firewall address.

ssh root@192.168.2.1

Enter your user password when prompted.

Step 3. Add Debian Repository

Once logged in, we need to add the proper repo that will allow us to install lm_sensors, a linux hardware monitoring tool. The first step is to open and edit the sources.list file.

Open the file using nano.

nano /etc/apt/sources.list

Add this line to the newly opened file.

deb http://ftp.debian.org/debian stable main contrib non-free
Source list

Save the file with Ctrl+O and then hit your return key to write the file.

Ctrl+X to exit.

You should be back at the command line prompt.

Step 4. Update and Install

Run the following to install lm_sensors.

sudo apt update
sudo apt-get install lm-sensors

Step 5. Setup

Next we need to probe the hardware to determine what kernel modules can be loaded.

sudo sensors-detect

I personally used all “defaults” here by hitting the return key for each answer. You’ll get a summary at the end. And finally, it will ask you: “Do you want to add these lines automatically to /etc/modules?”. Hit return and you are done!

Step 6. Run Sensors

Type the following:

sensors

On my system it looks like this:

Dell r210 ii running lm_sensors

That’s it, you have an easy way to check temps on your Untangle machine.

Notes

I’m using a Dell r210 that has been upgraded with a Dell r210 ii motherboard to run Untangle NG Firewall. I have the home software license for Untangle.

Dell r210 upgraded to Dell r210 ii

The specs are:

Dell r210 chassis
Dell r210 ii motherboard
CPU: Intel Xeon E3-1220v2
Memory: 4GB
Storage: 120GB SSD
iDRAC 6 Enterprise
Noctua NF-A4x20 FLX (1) – power supply fan
Noctua NF-A4x20 PWM (3) – chassis fans

Categories
homelab

Disable Dell r720xd Cooling Response When GPU Is Added

I recently added a Nvidia GTX 970 to my Dell r720xd server. The first thing I noticed was the fans ramped up quite a bit and this system is usually very quiet.

Dell r720xd with Nvidia GTX 970

Yes, I know I can use IPMI and easily set the fans at a fixed lower rpm. However, I’d rather leave it up to the OS to manage the fan speed, if possible.

It turns out that the server is designed to automatically adjust cooling when third party PCIe cards are added.

You can disable the cooling response logic with this command:

ipmitool -I lanplus -H IPADDRESS -U USERNAME -P PASSWORD raw 0x30 0xce 0x00 0x16 0x05 0x00 0x00 0x00 0x05 0x00 0x01 0x00 0x00

You can enable the cooling response logic with this command:

ipmitool -I lanplus -H IPADDRESS -U USERNAME -P PASSWORD raw 0x30 0xce 0x00 0x16 0x05 0x00 0x00 0x00 0x05 0x00 0x00 0x00 0x00 

To determine the cooling response logic status:

ipmitool -I lanplus -H IPADDRESS -U USERNAME -P PASSWORD raw 0x30 0xce 0x01 0x16 0x05 0x00 0x00 0x00 

The response data looks like this:

16 05 00 00 00 05 00 01 00 00 (Disabled)
16 05 00 00 00 05 00 00 00 00 (Enabled)

A couple notes about this process. Make sure your card, GPU or otherwise, can handle the low airflow. Check temperatures after you disable the fan response. Second, your iDRAC firmware my need to be updated if the command does not work. My r720xd is on version 2.65.65.65 at the time of this post.