
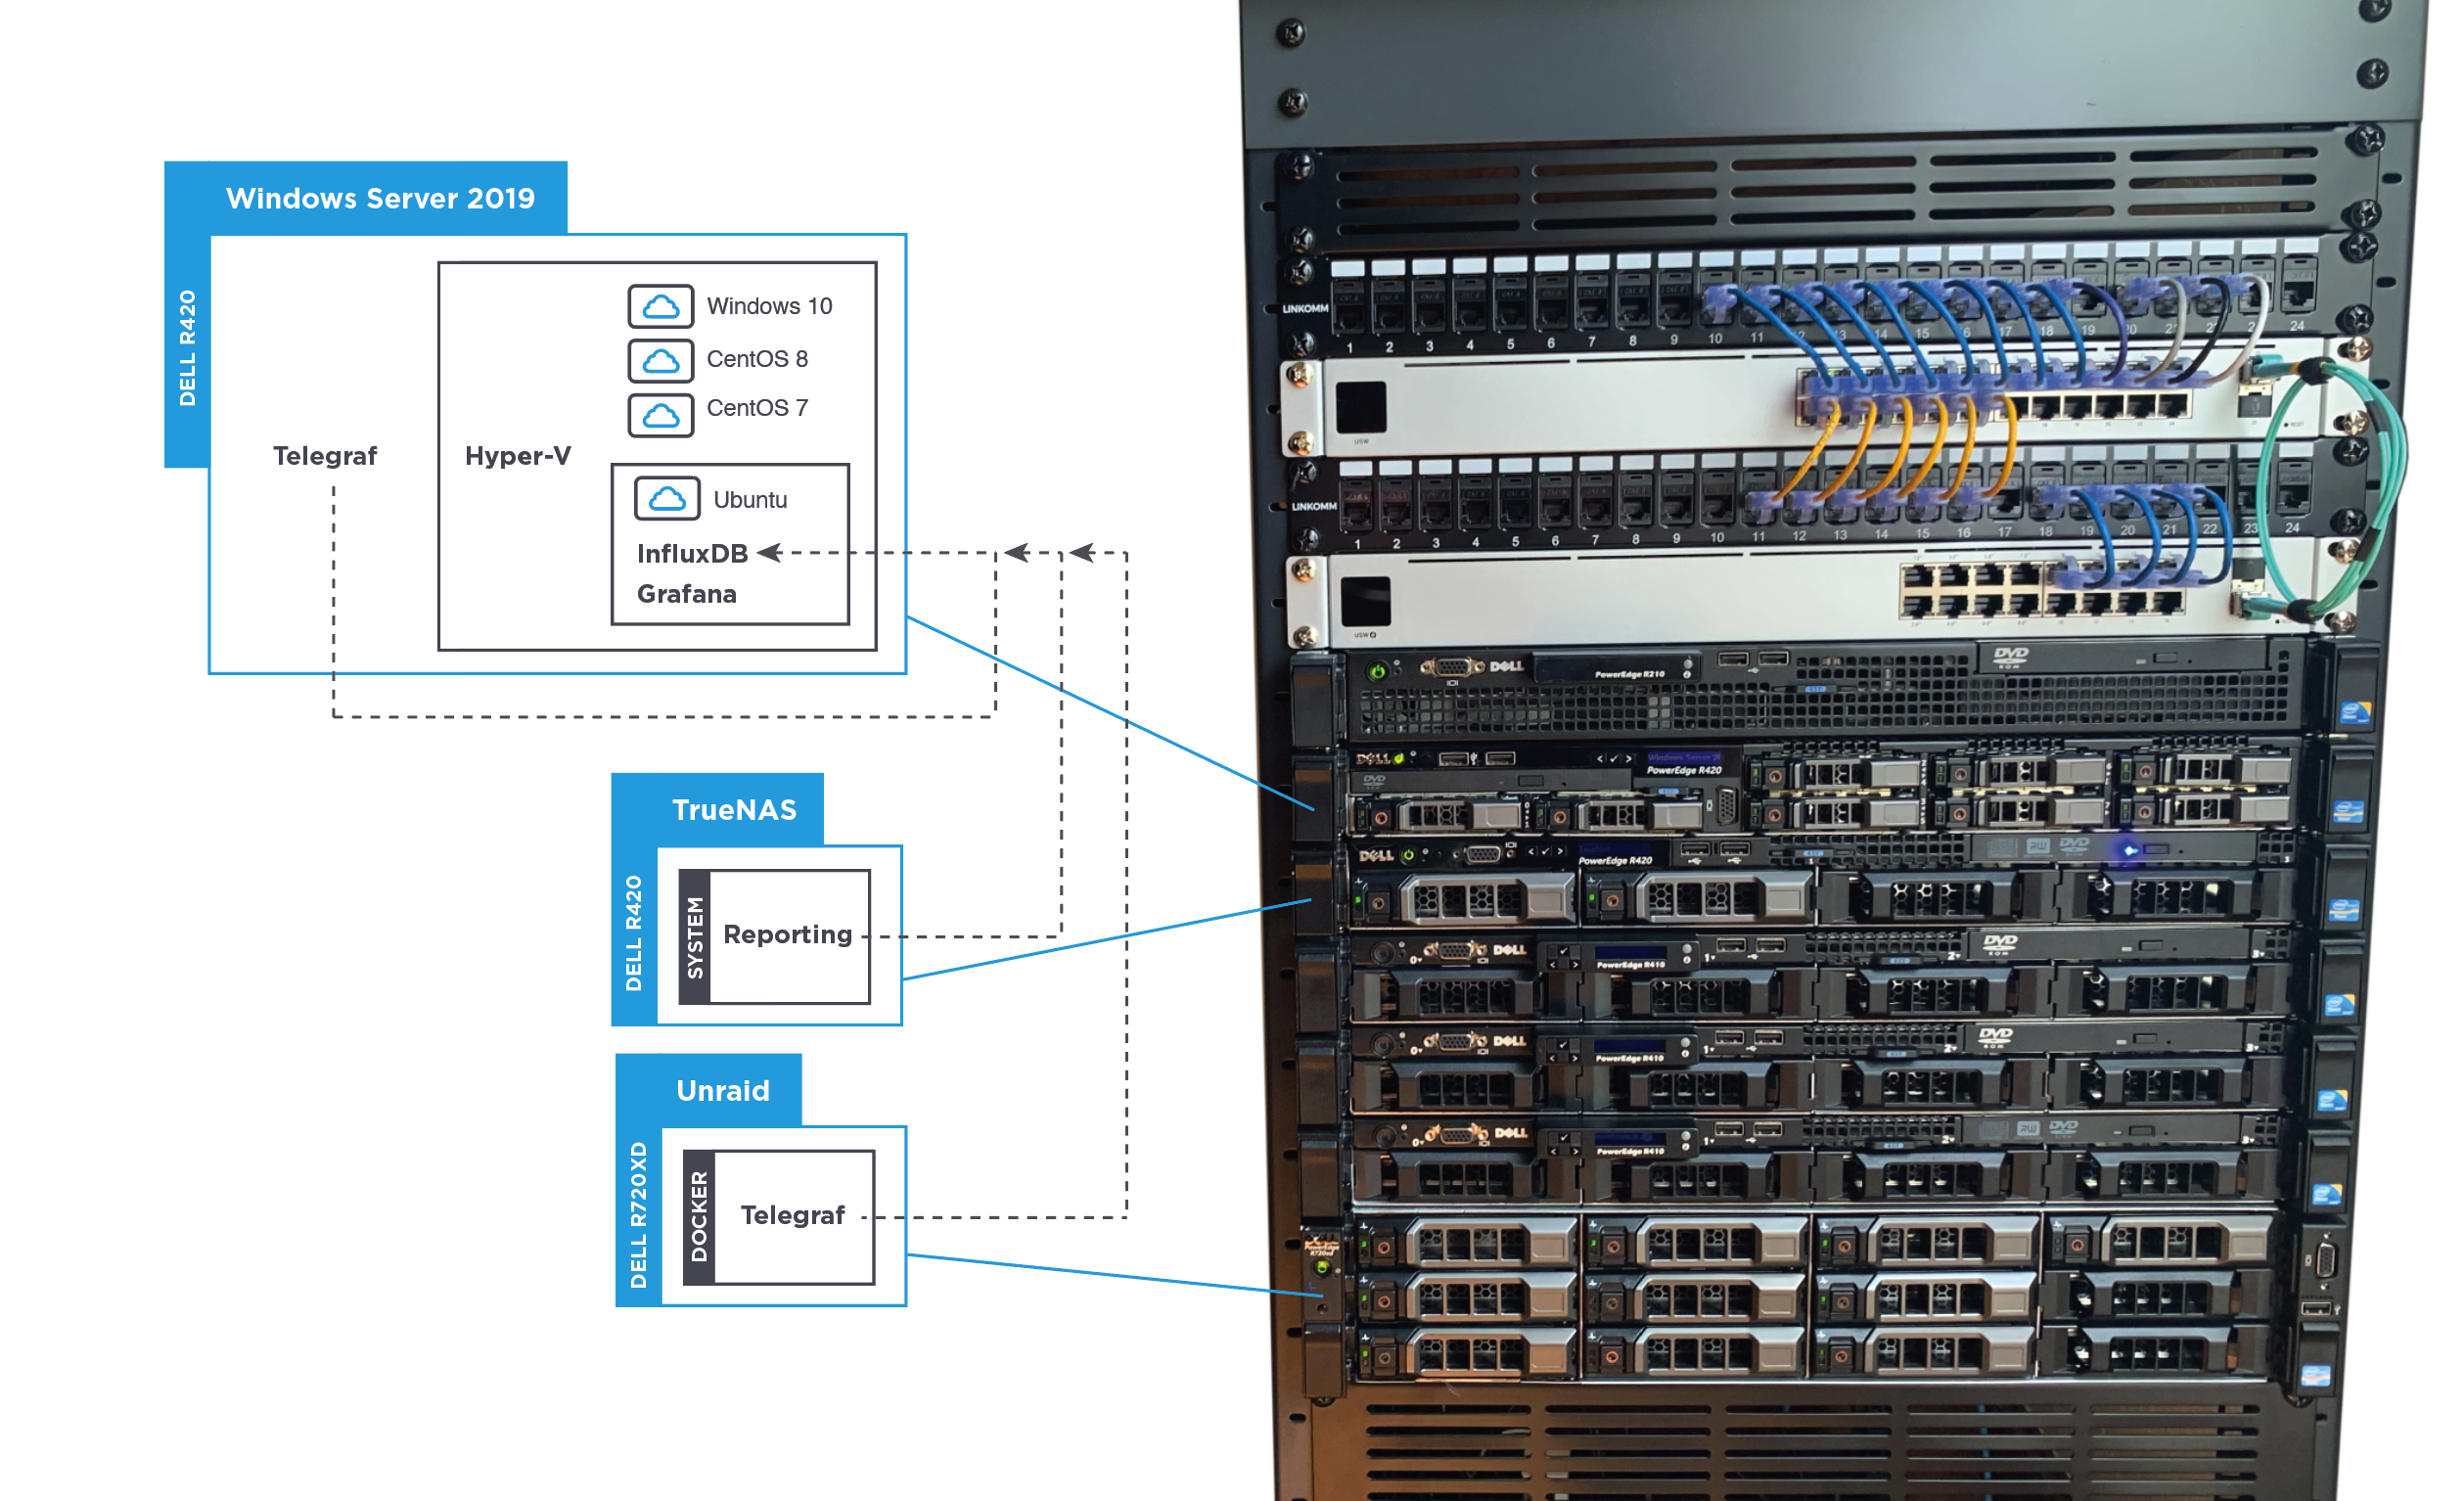
The first thing I want to show is the organization of my homelab so you can visualize where each operating system resides and how the data will be sent to our InfluxDB and then displayed on the Grafana dashboard.
Step 1. Choose a location and operating system for Grafana & InfluxDB
I’m going to create a Ubuntu 20.04 virtual machine using Hyper-V on a machine running Windows Server 2019. This is my small form factor Dell r420 and I’m choosing this since I leave it running 24/7. You could use a Raspberry Pi or any machine on your home network that you want to leave on since it will be the location you collect data for your dashboard. We will install InfluxDB and Grafana on the Ubuntu virtual machine.
I’ll be using Microsoft Remote Desktop on MacOS to connect to Windows Server 2019. Yes, I’m on MacOS Catalina, a Hackintosh to be specific, using Microsoft Remote Desktop to install Ubuntu on Windows Server. We might break the time-loop continuum.
Step 2. Enable SSH
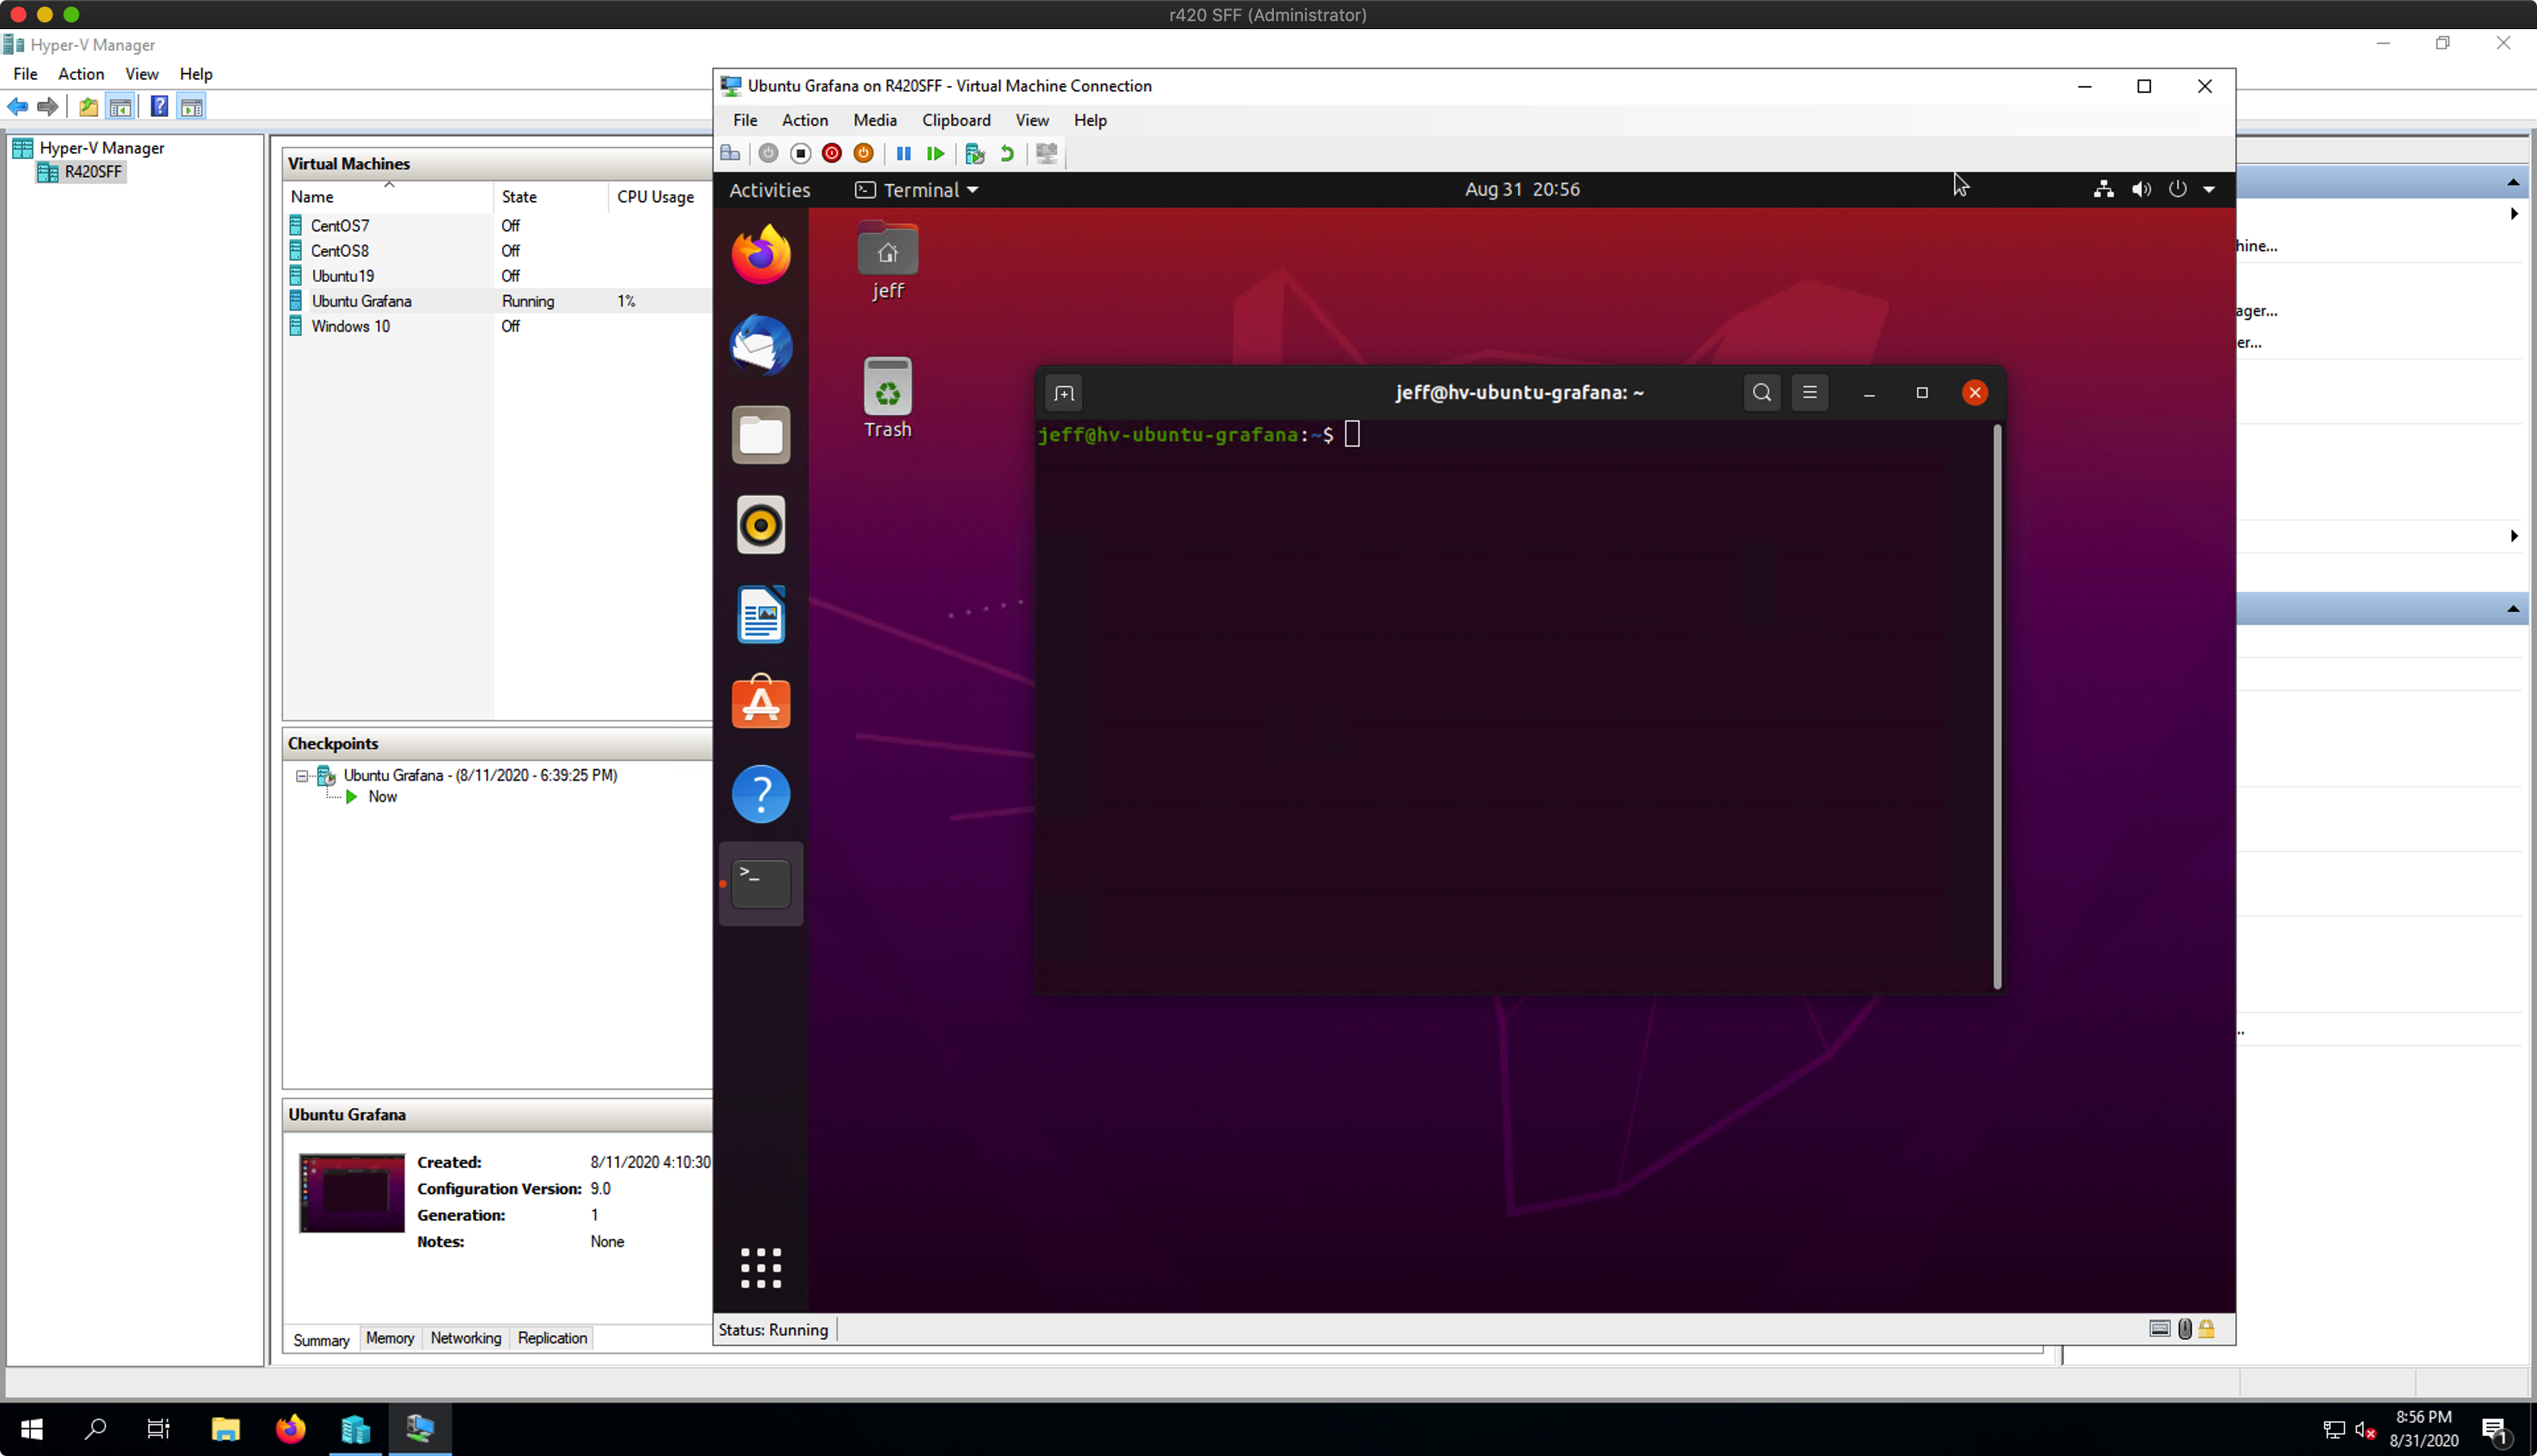
Access the Ubuntu desktop in Hyper-V. Open the terminal on Ubuntu and install the openssh-server package:
sudo apt update
sudo apt install openssh-server
Enter your password if prompted. Answer Y to complete the package installation.
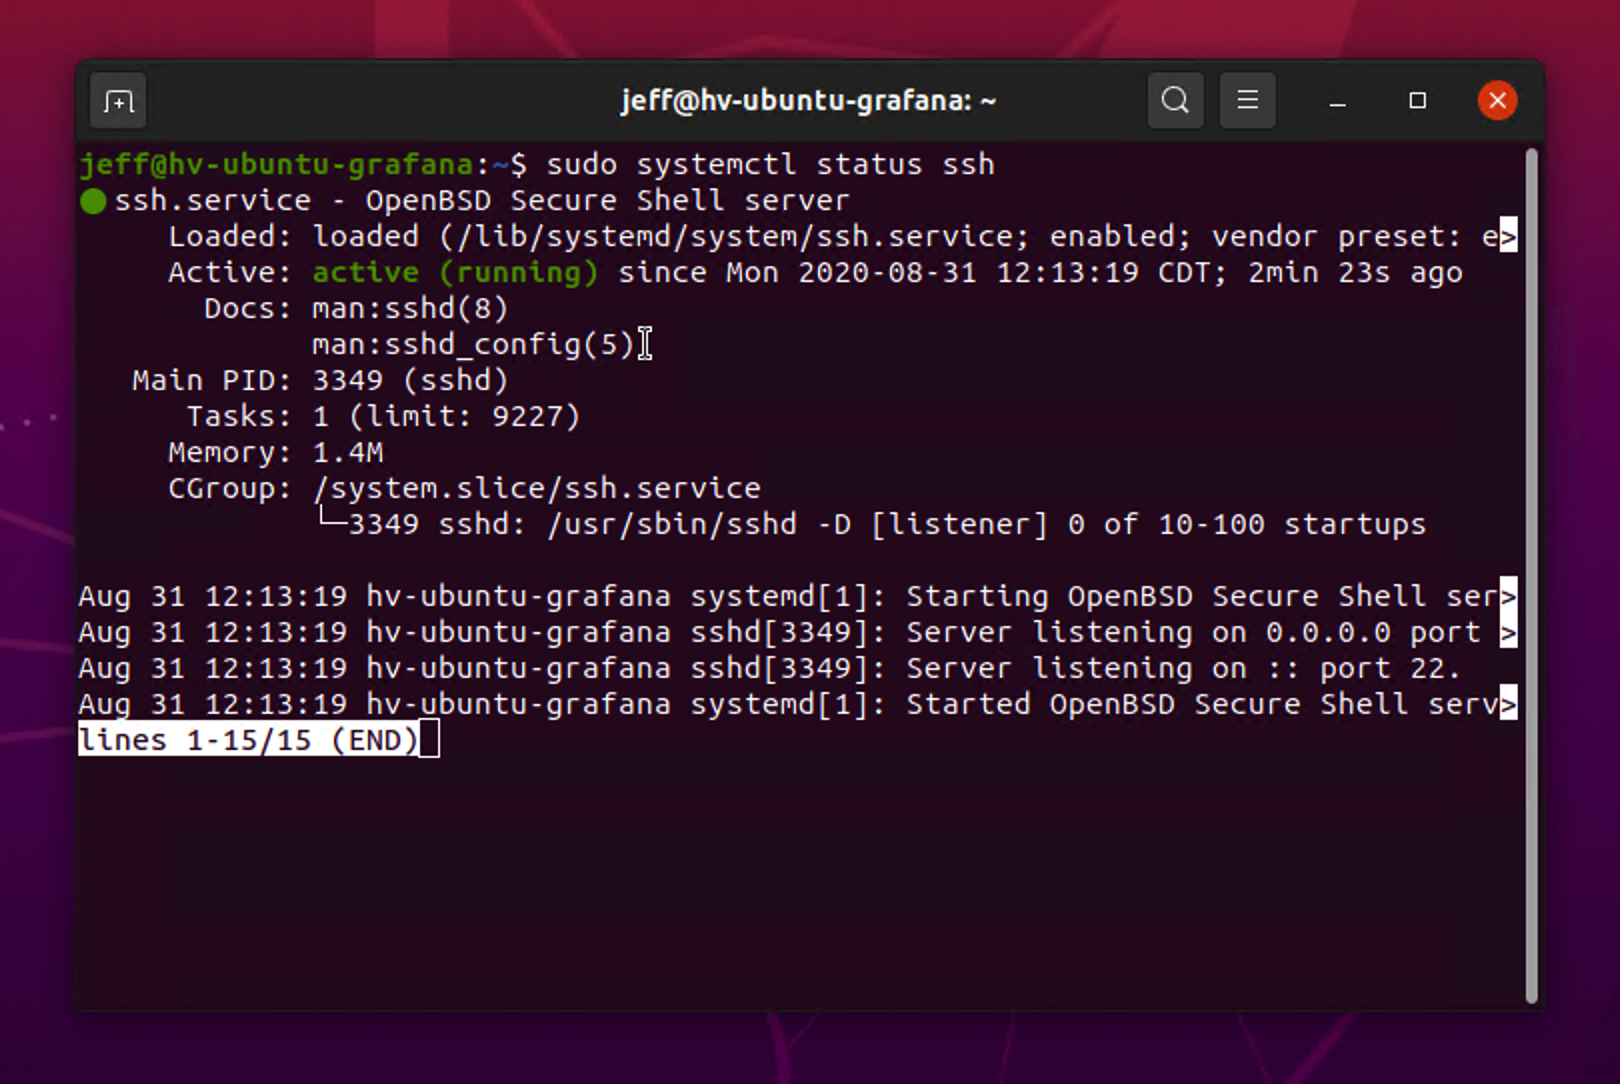
Verify that SSH is running by typing:
sudo systemctl status sshYou should see something like this to tell you the service status:
Enable SSH so it will start next time your reboot:
sudo systemctl enable sshLastly, get your virtual machine IP address by typing:
ip addressI can now close out my remote connection to the server and work from MacOS Terminal to access Ubuntu by SSH.
Step 3. Connect to Ubuntu with SSH
Use a command line tool of your choice to connect to the virtual machine. I’m using MacOS Terminal. Using the user account you created when installing Ubuntu and the virtual machine ip address, type the following:
ssh jeff@192.168.2.144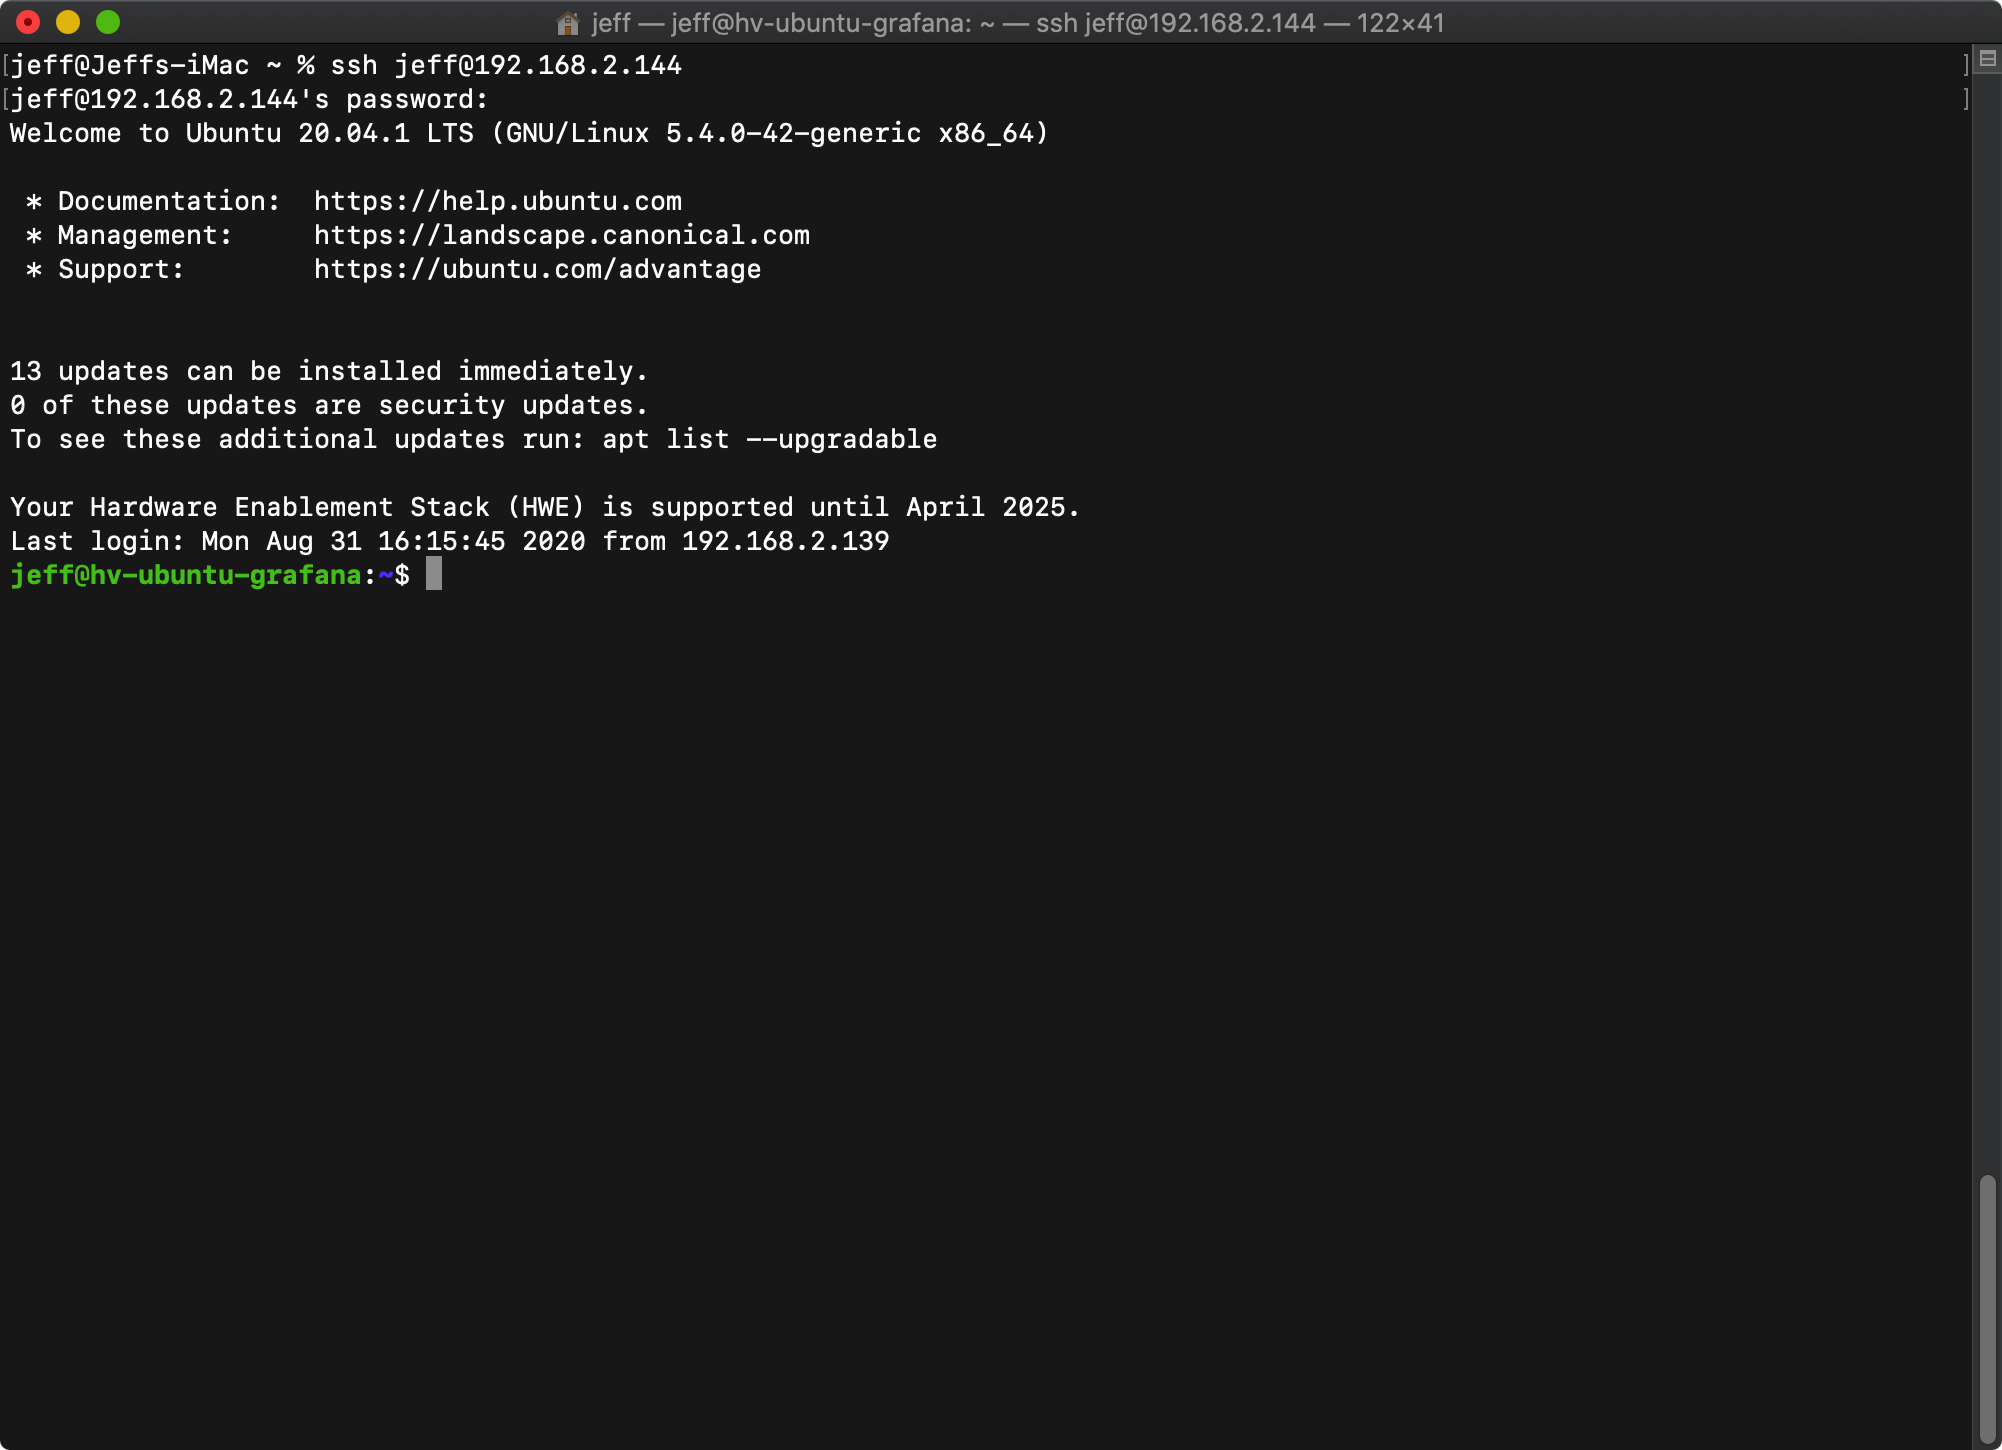
Step 4. Install InfluxDB
Add the InfluxData repository with the following commands:
wget -qO- https://repos.influxdata.com/influxdb.key | sudo apt-key add -
source /etc/lsb-release
echo "deb https://repos.influxdata.com/${DISTRIB_ID,,} ${DISTRIB_CODENAME} stable" | sudo tee /etc/apt/sources.list.d/influxdb.list
This will add a new source file to our Ubuntu installation. You can verify the file exists or make additional changes by using the following:
sudo nano /etc/apt/sources.list.d/influxdb.listYou should see this:
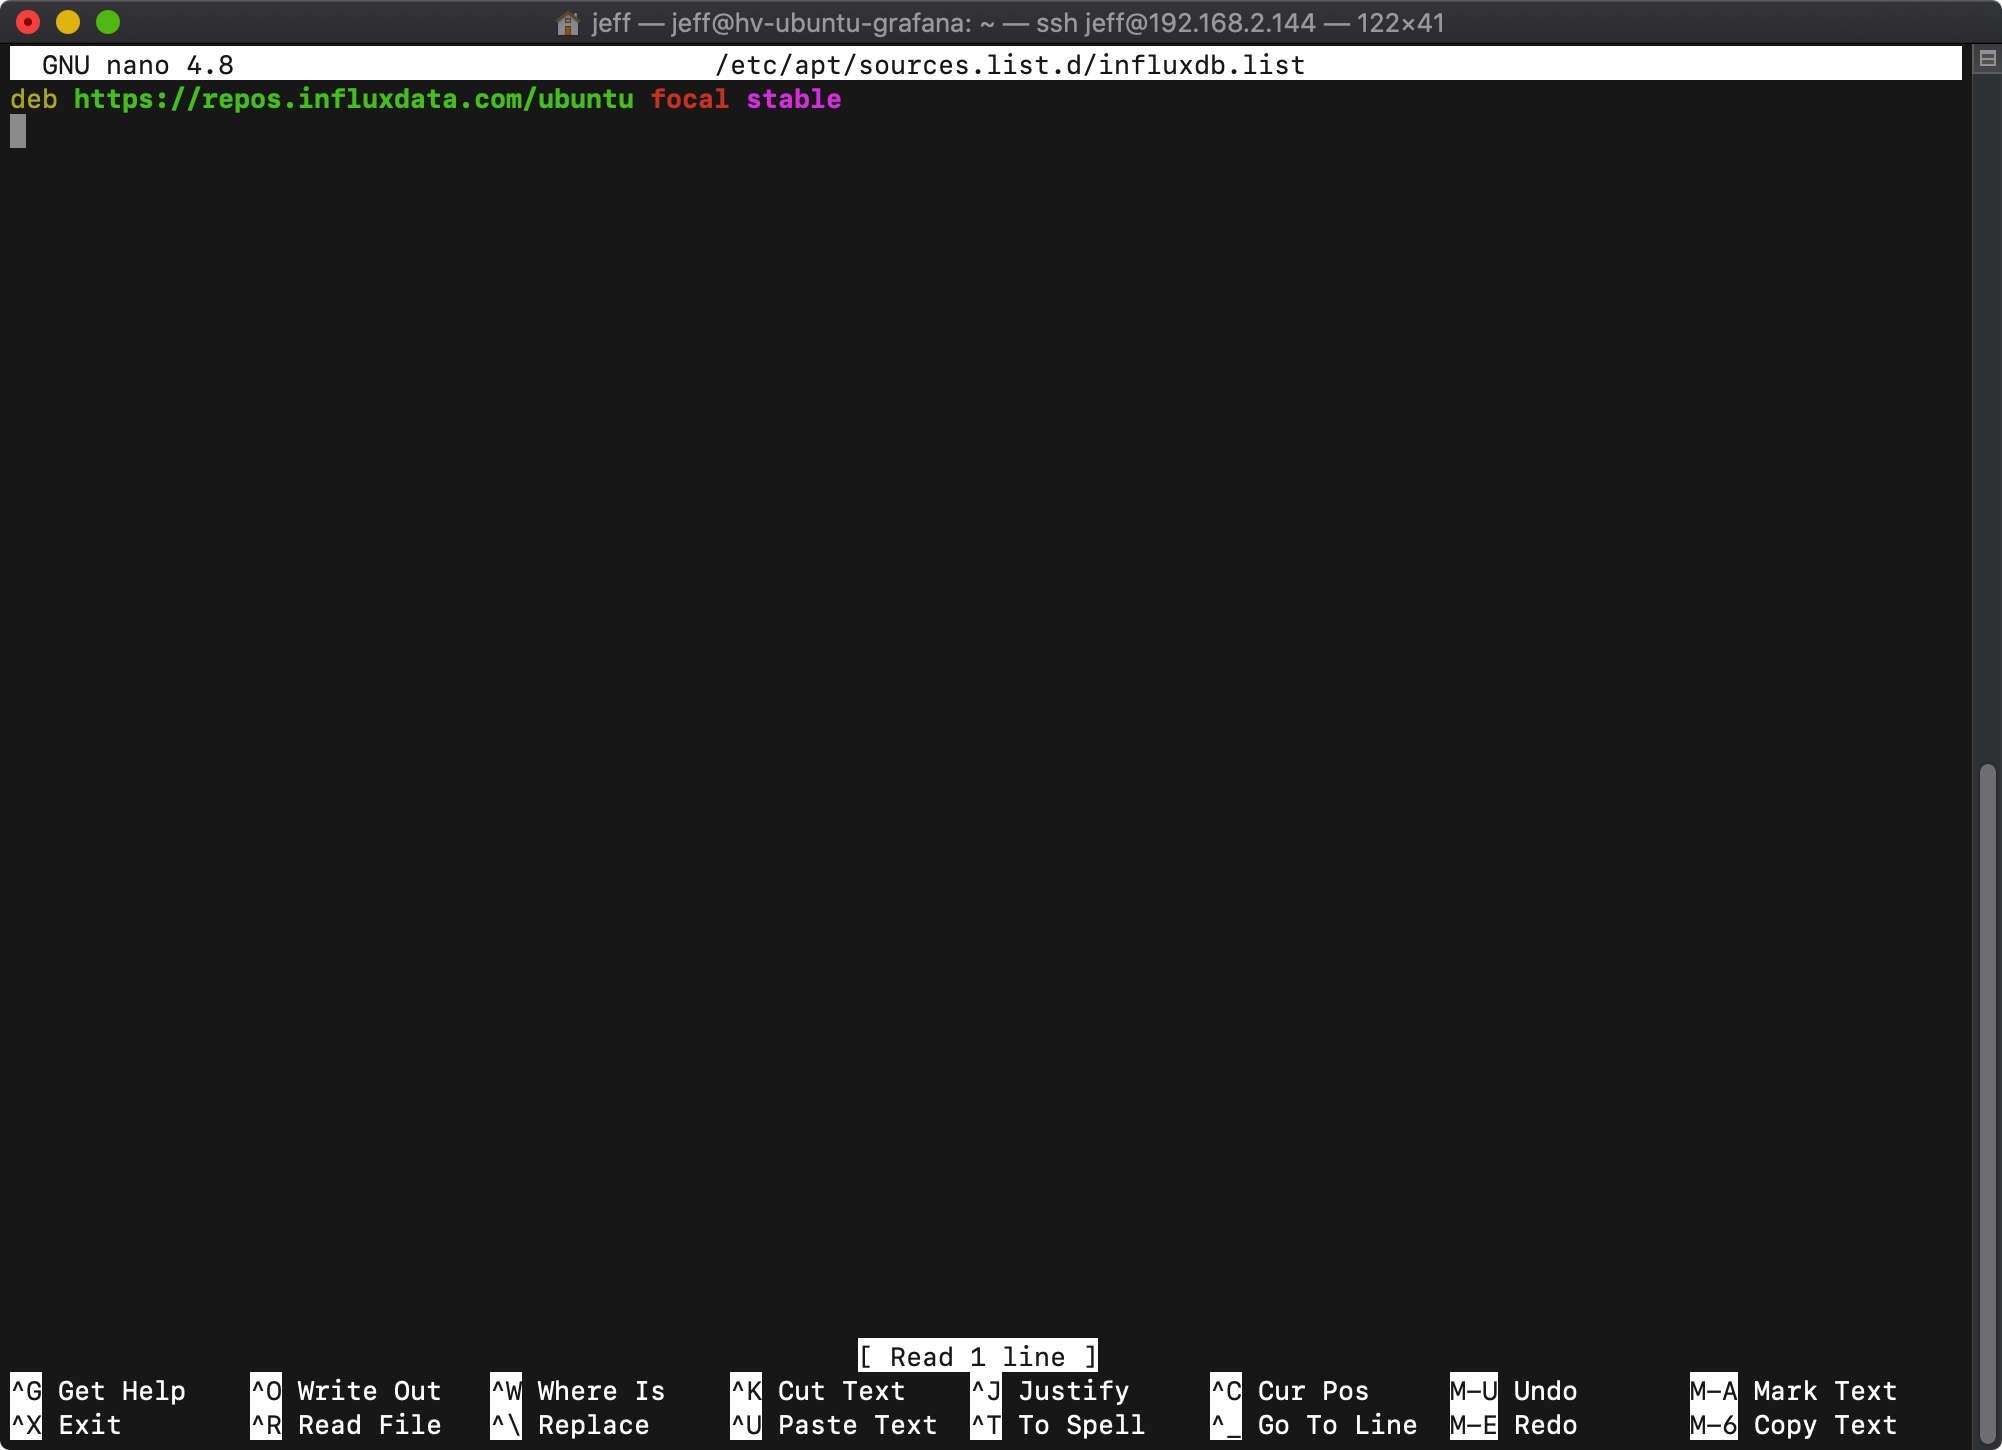
Exit the file by typing Ctrl+X.
Install and start the InfluxDB service with:
sudo apt-get update && sudo apt-get install influxdb
sudo systemctl unmask influxdb.service
sudo systemctl start influxdb
Check that the service is running:
sudo systemctl status influxdbYou should get something like this:
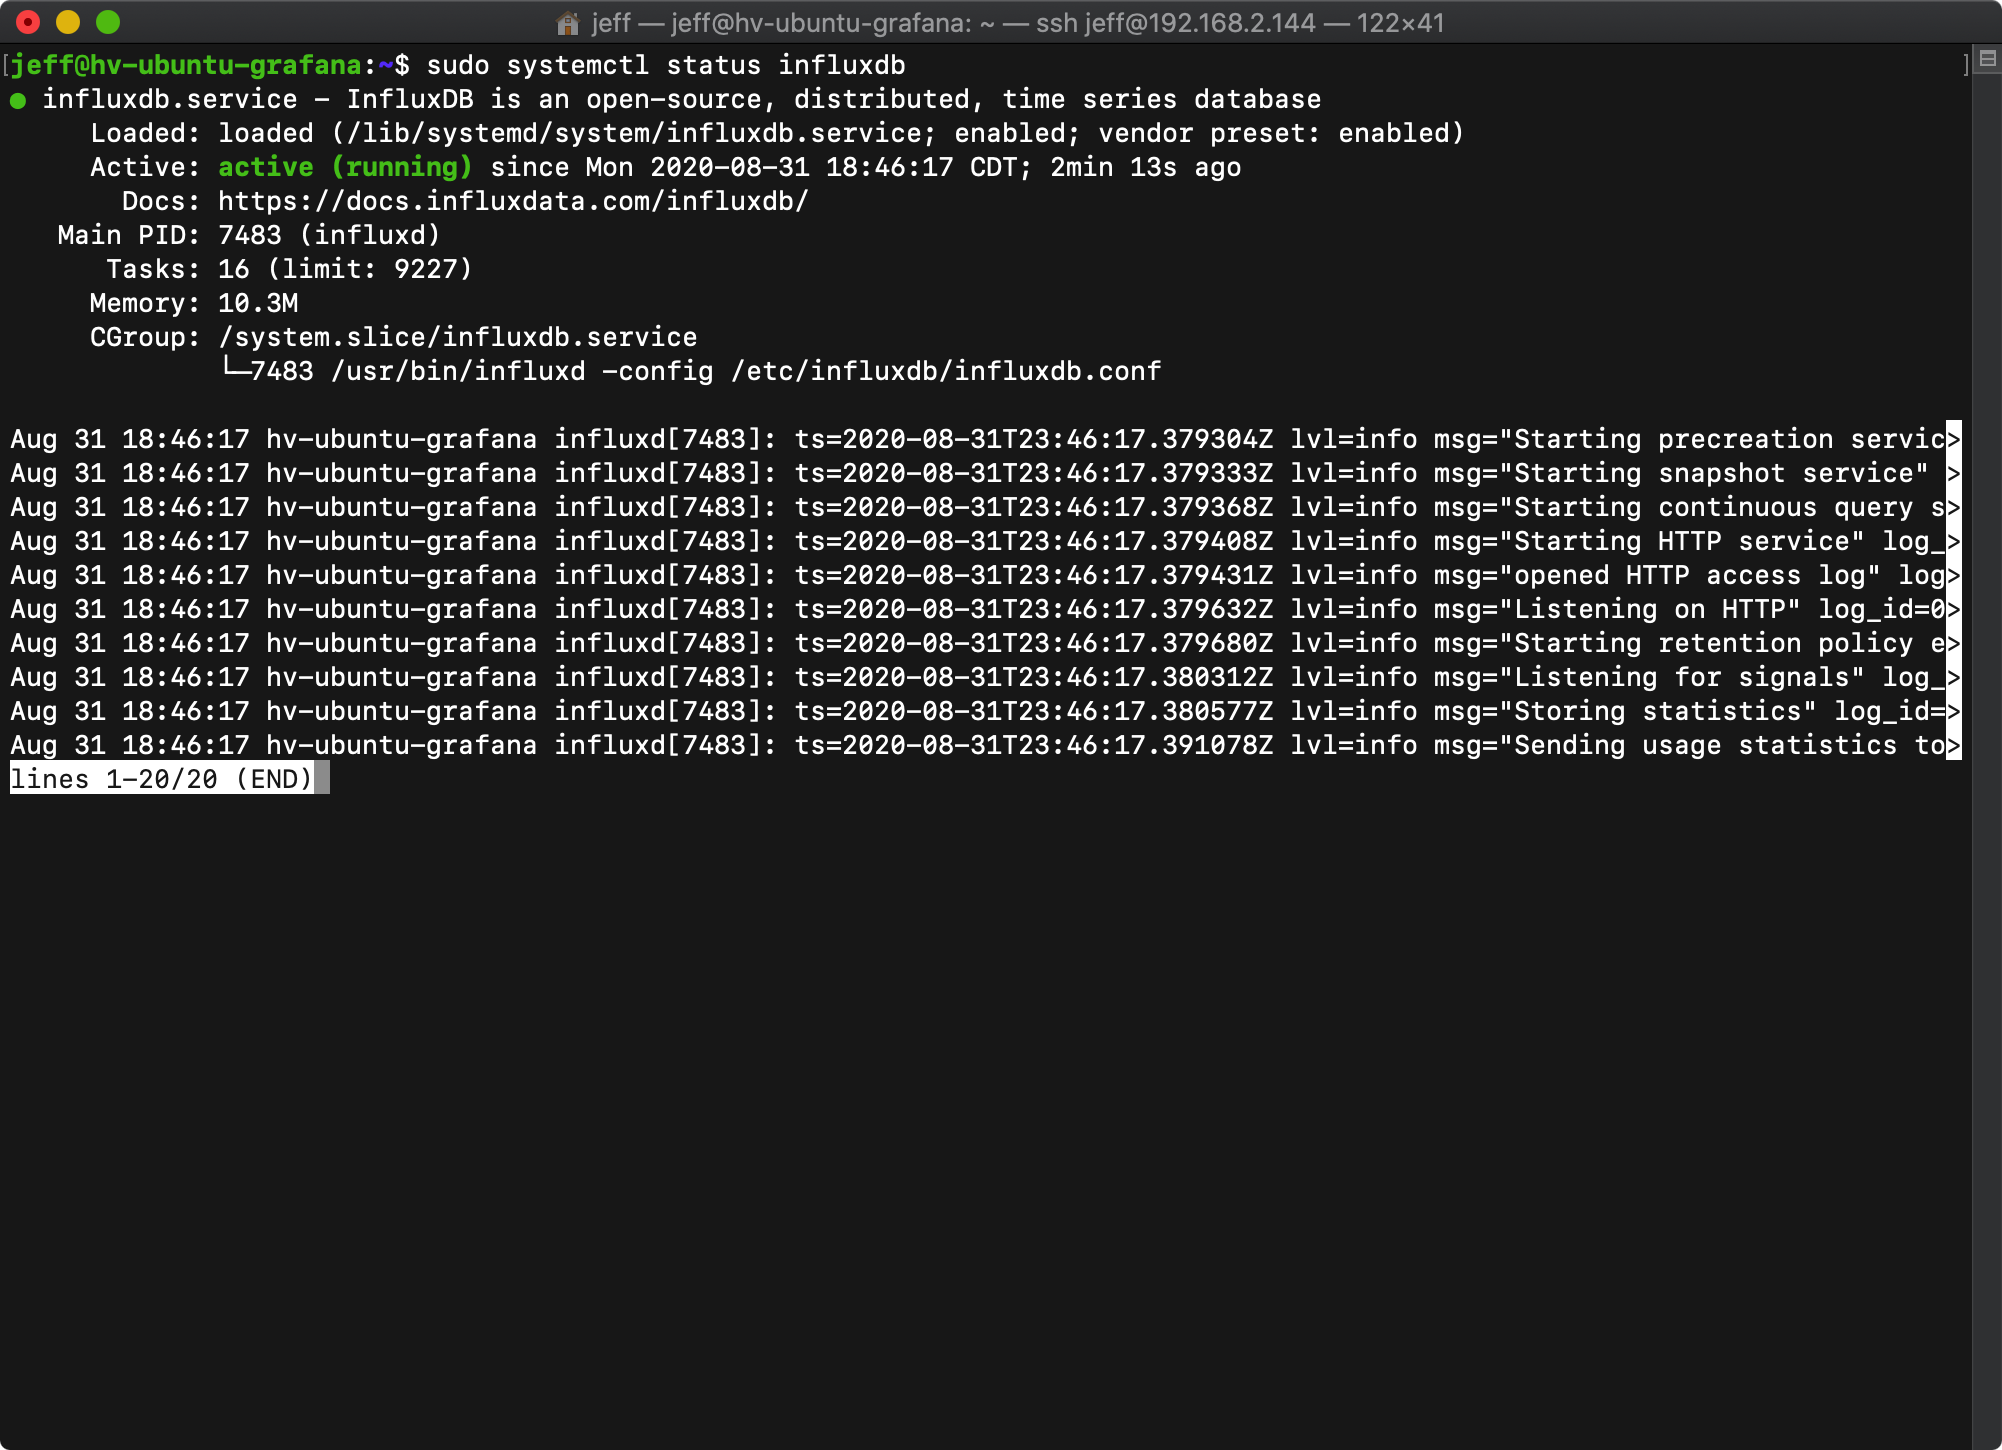
Let’s make sure the service starts on the next boot:
sudo systemctl enable influxdbThe InfluxDB service is now installed and running.
Step 5. Configure InfluxDB
First, create an admin user so we can enable authentication for the InfluxDB service. Access InfluxDB like this:
influxCreate the user:
CREATE USER admin WITH PASSWORD 'yourpassword' WITH ALL PRIVILEGES
SHOW USERS
EXIT
We need to make several changes to the configuration of InfluxDB. We do that by editing the InfluxDB config file:
sudo nano /etc/influxdb/influxdb.confRemove the # character from these 3 lines under the [http] section and change auth-enabled to true:
enabled = true
bind-address = ":8086"
auth-enabled = true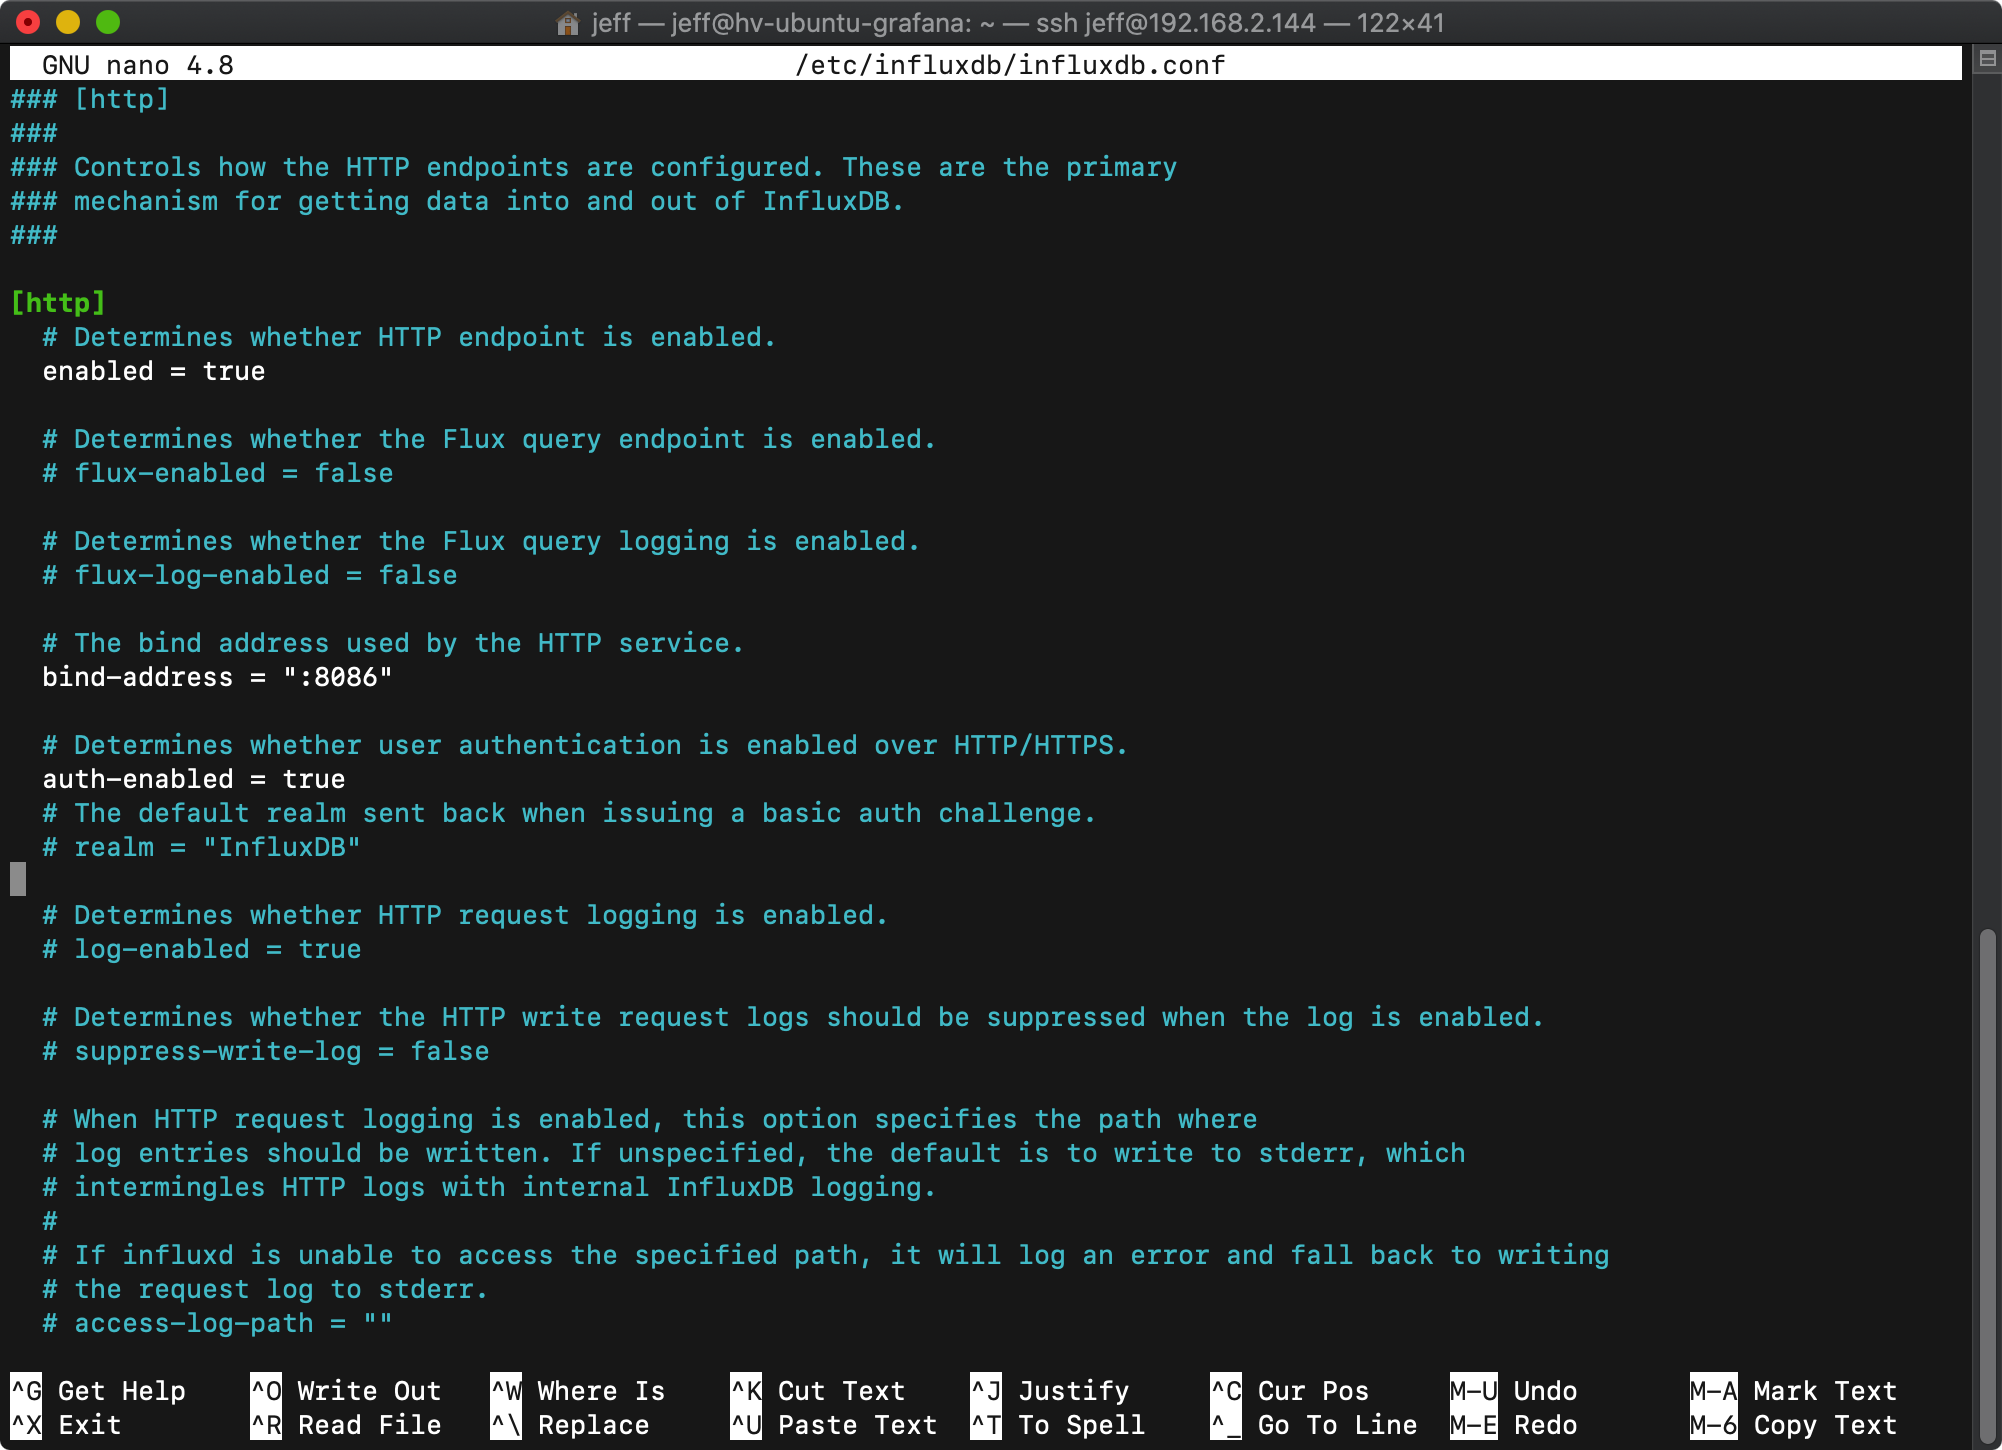
Write the file by typing Ctrl+O and exit the file by typing Ctrl+X.
Open port 8086 on the firewall. This is crucial or you will not get any data sent to your Influx database.
sudo ufw enable
sudo ufw allow 8086/tcp
Restart the InfluxDB service.
sudo systemctl restart influxdbLog back into InfluxDB with:
influx -username admin -password yourpasswordCreate a database and user to store our data sent from Telegraf.
CREATE DATABASE telegraf
CREATE USER telegraf WITH PASSWORD 'telegrafpassword'
GRANT ALL ON telegraf TO telegraf
I know, I’m using the same name for my database and user. This is a matter of preference, pick something that works for you.
InfluxDB is now ready to receive data!
Step 6. Install Telegraf
Telegraf is the tool we use to gather the metrics and send that data to our InfluxDB database. The important things to realize at this point is we can send data to InfluxDB from anywhere in our homelab, as long as we can use something like Telegraf on that machine/service/vm to do it. Services like pfSense, TrueNas and Unraid all have their own unique ways to send data to InfluxDB as well.
I plan to send data from as many services in my homelab as possible. For now, I’ll start with Windows Server 2019.
This is the same server where I have the VM setup. Open Powershell as Administrator and run the following:
cd ~\Downloads
wget https://dl.influxdata.com/telegraf/releases/telegraf-1.15.2_windows_amd64.zip -outfile telegraf-1.15.2_windows_amd64.zip
unzip .\telegraf-1.15.2_windows_amd64.zip
Expand-Archive -Path telegraf-1.15.2_windows_amd64.zip -DestinationPath 'C:\Program Files'
cd 'C:\Program Files'
Rename-Item telegraf-1.15.2 Telegraf
Telegraf is now downloaded, unzipped and moved to the correct directory. We can now install the service. Run the following in PowerShell:
C:\"Program Files"\Telegraf\telegraf.exe --service installThe Telegraf service is ready for configuration and you should see it now in the Services app. Don’t start it yet.

Now we need to configure Telegraf and tell it to send the data to our Ubuntu VM. Open the configuration file located here: C:\Program Files\Telegraf\telegraf.conf in Notepad or your favorite editor. I’m using Microsoft Visual Studio Code.
Change the following lines under [[outputs.influxdb]] (use the credentials you setup in InfluxDB):
urls = ["http://192.168.2.144:8086"]
database = "telegraf"
username = "telegraf"
password = "YOURPASSWORD"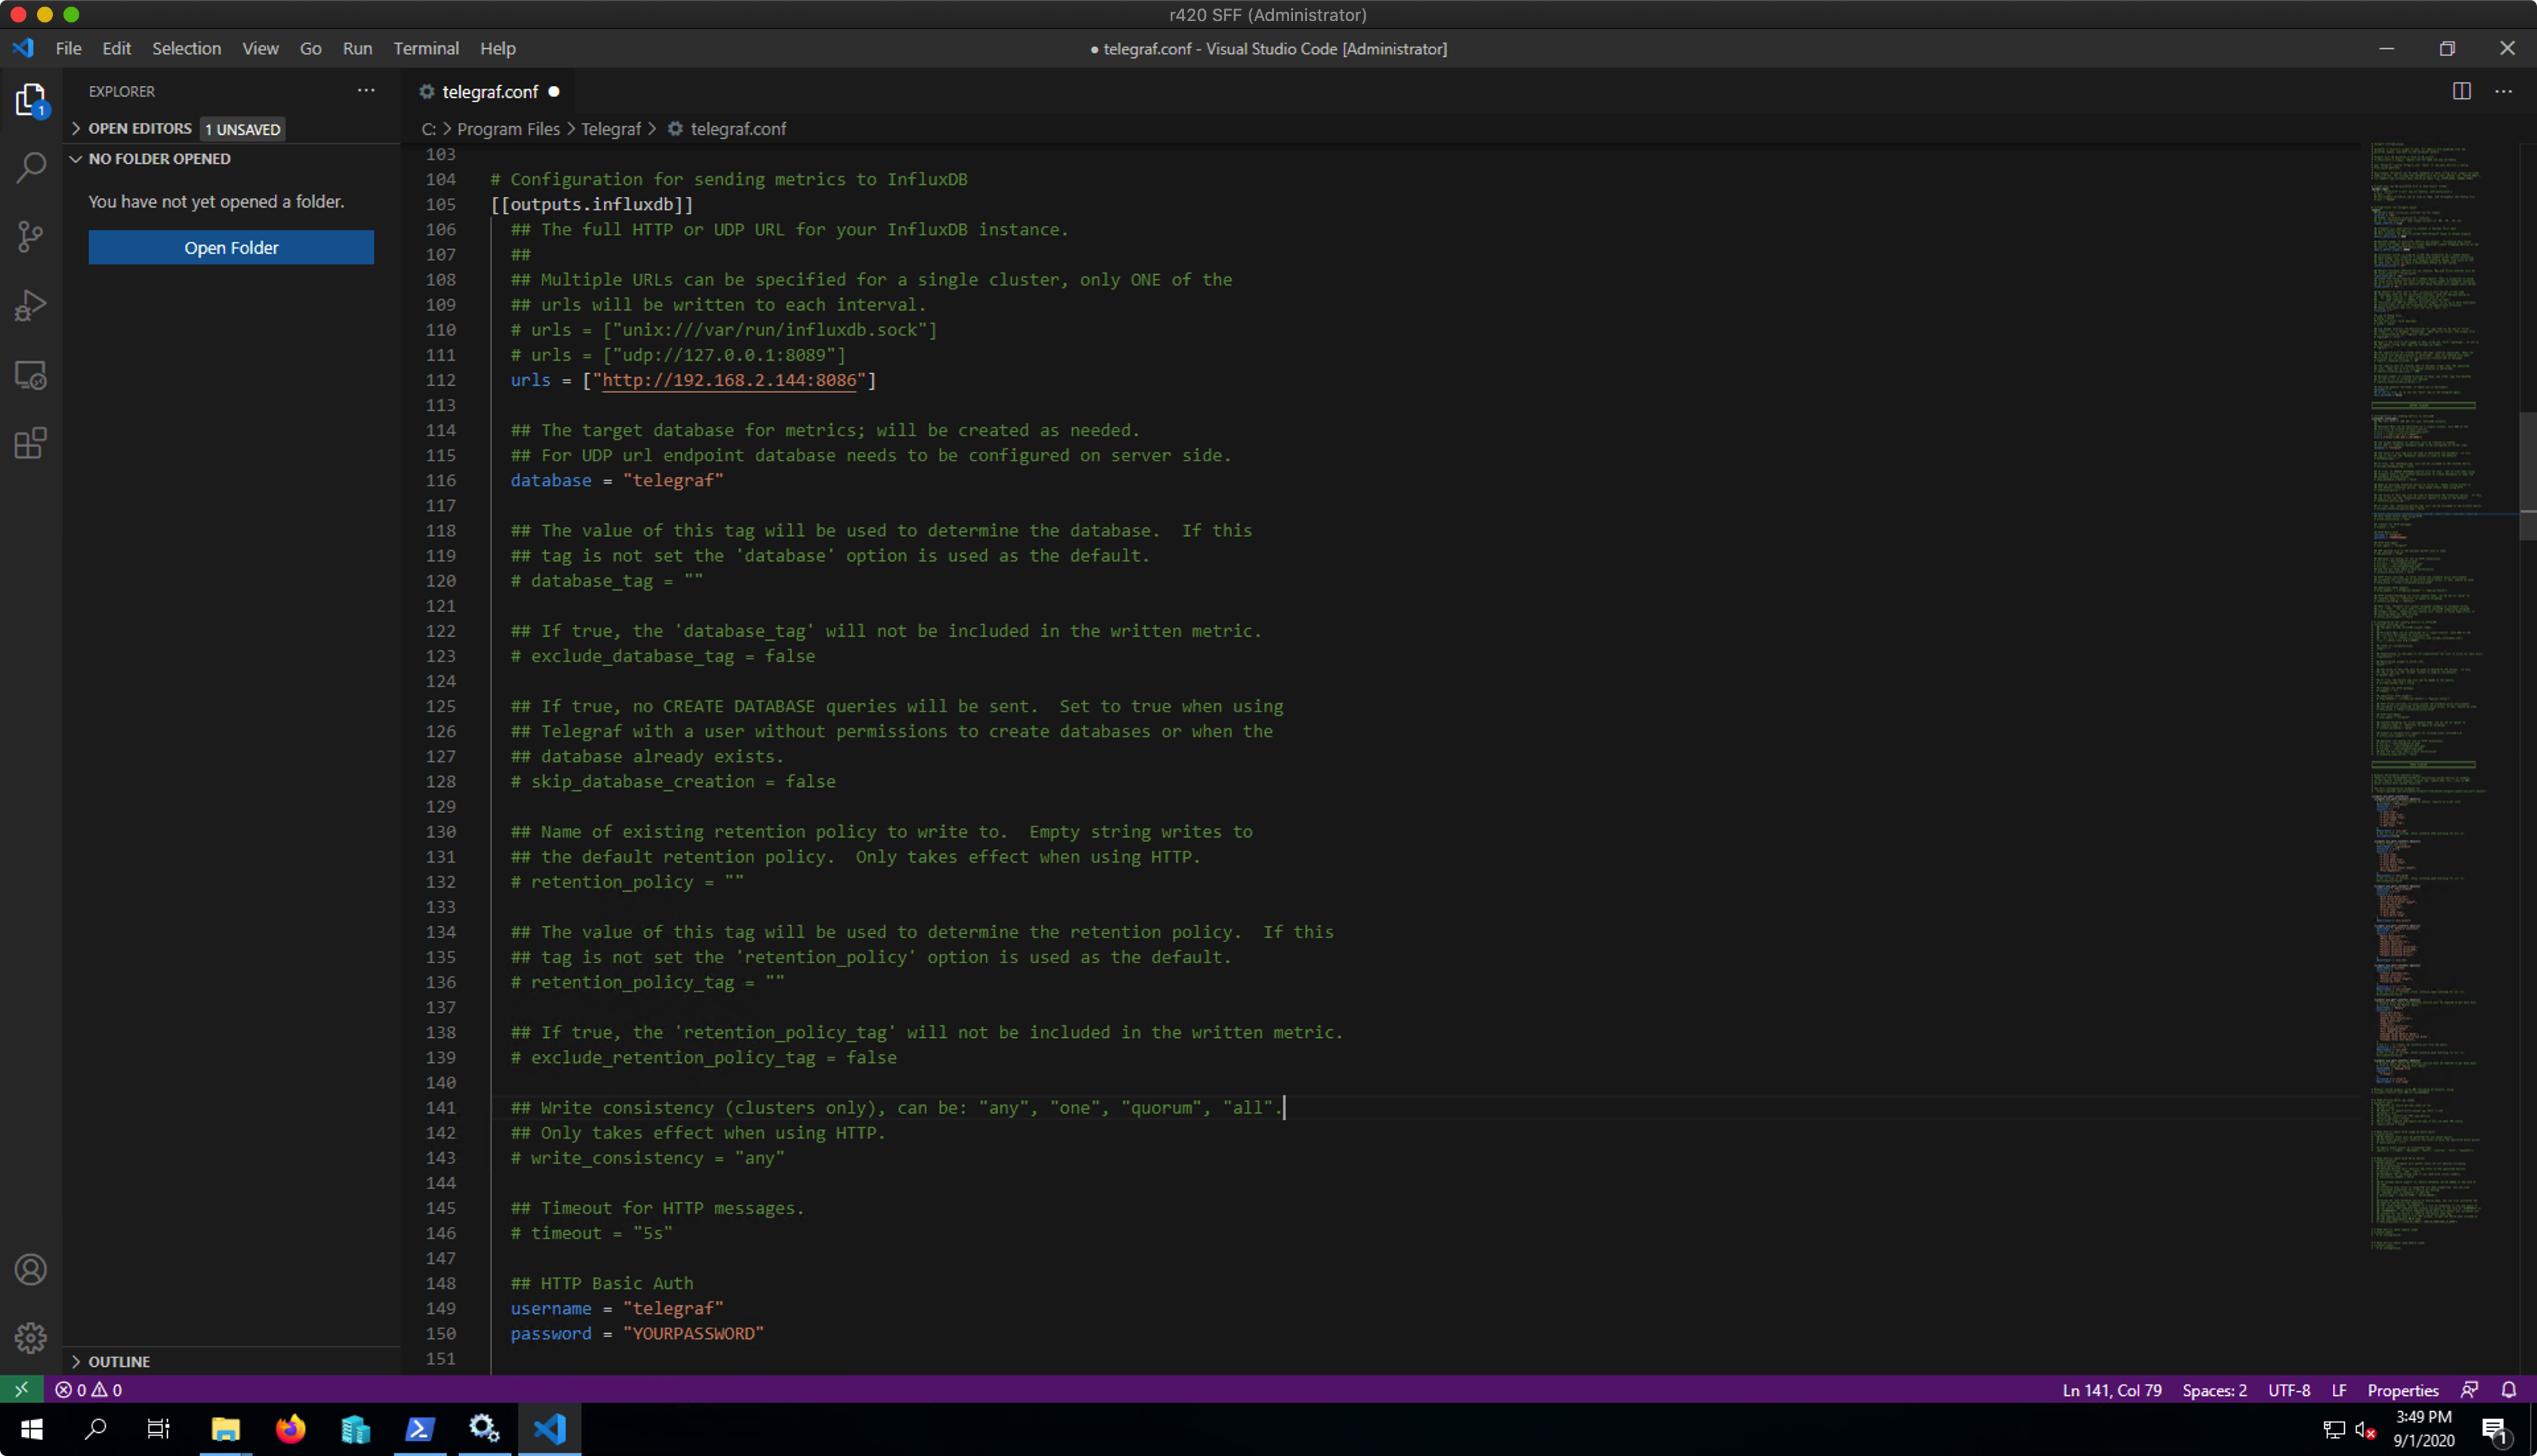
Make sure the Windows Performance Counters plugin is configured like your want. I’m leaving the default setup for now. Looks like this:

That’s it, we are done on Windows Server for now.
Back on MacOS Terminal, check to see if you are receiving data from Telegraf.
influx -username admin -password yourpassword
use telegraf
show measurements
SELECT * FROM win_cpu LIMIT 5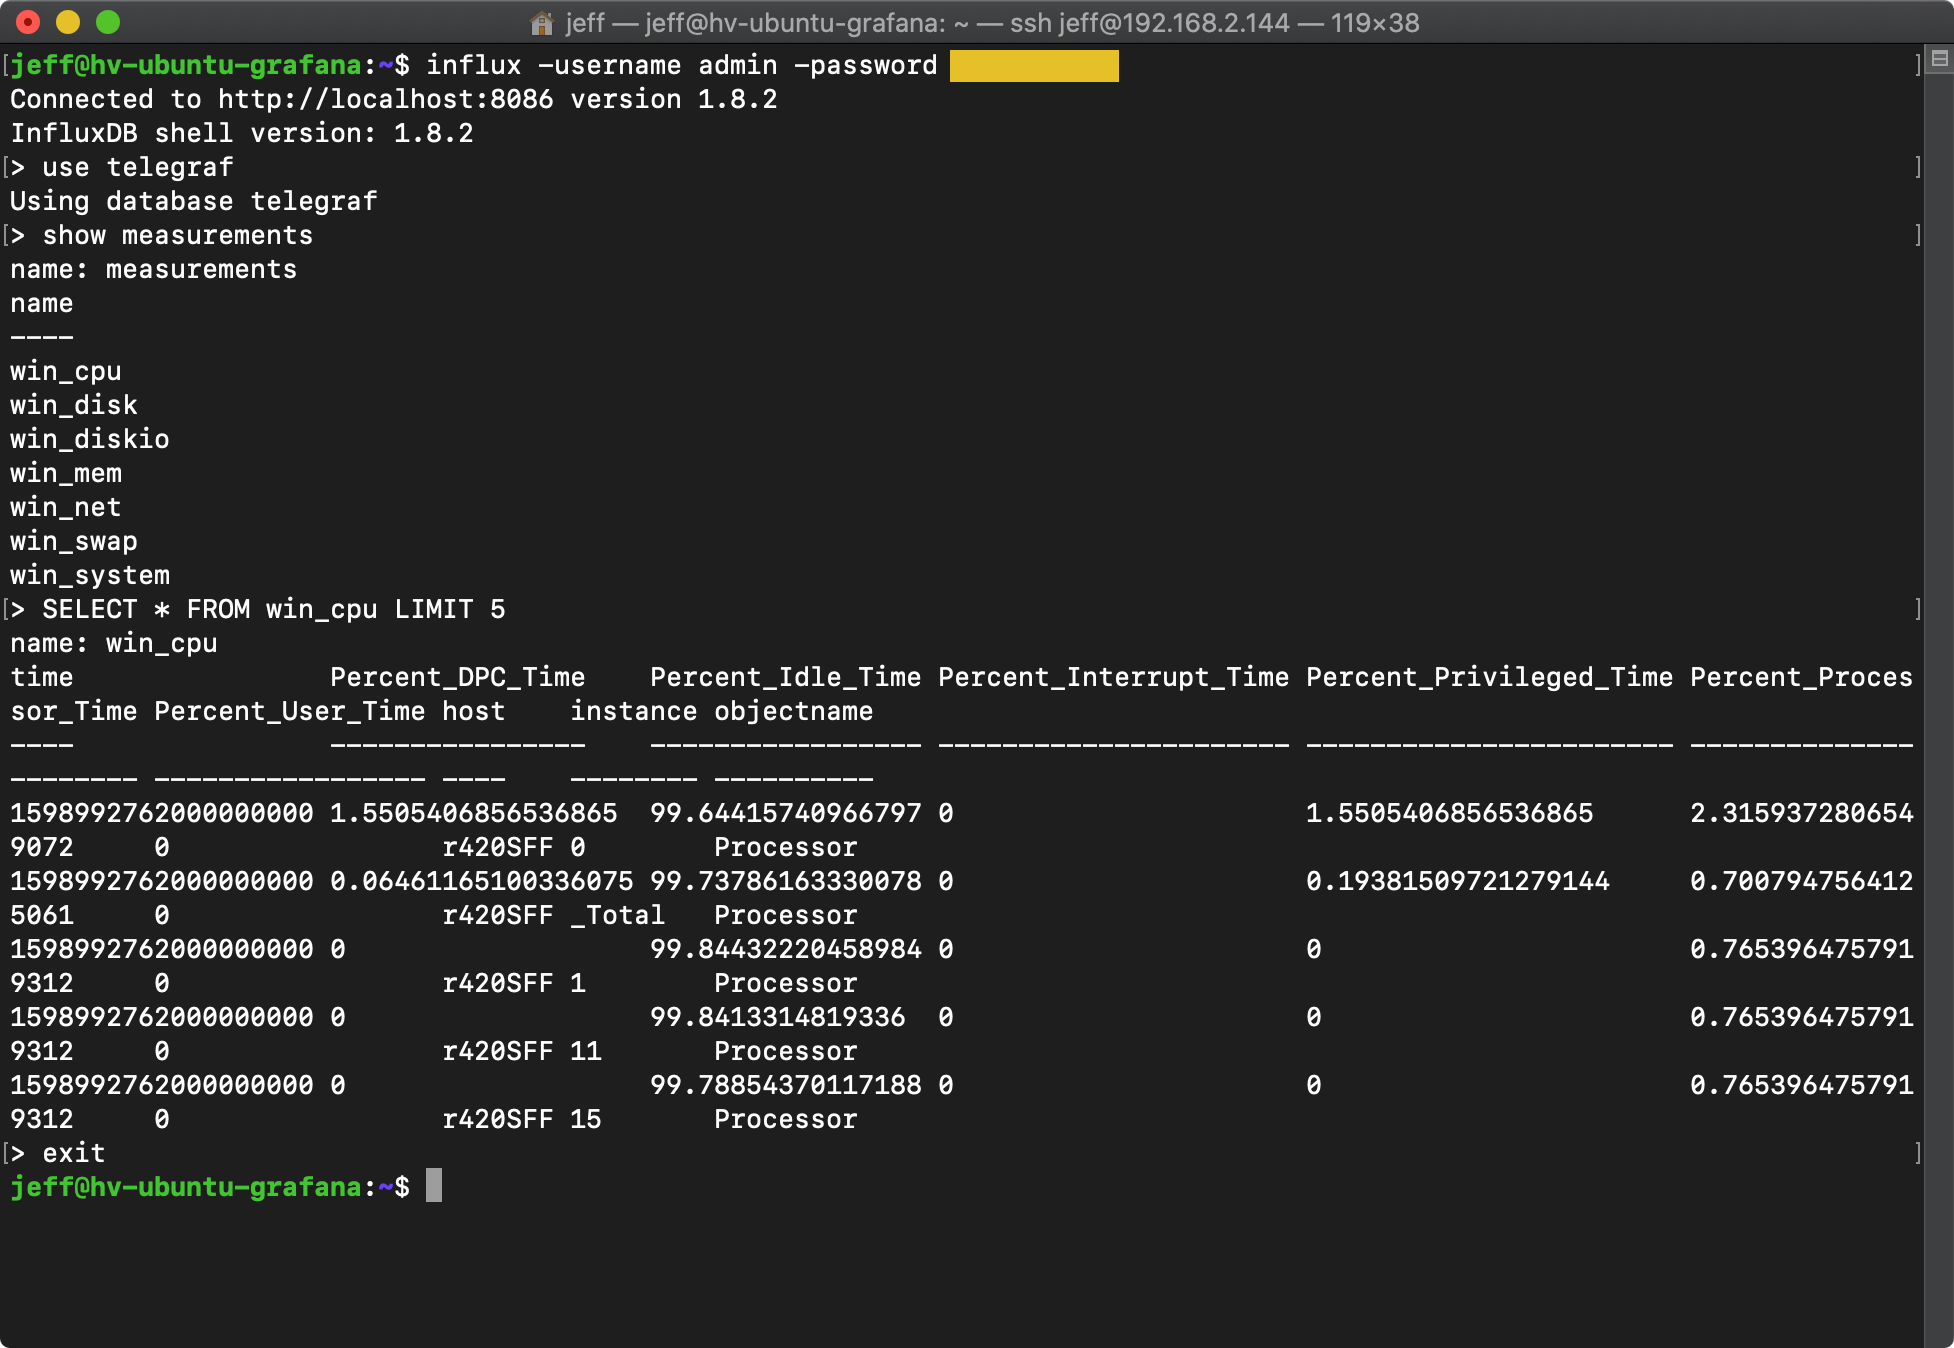
You can see the data that is being sent!
Note: There is a column titled “host” where you can see the name of the server sending the data.
Step 7. Install Grafana
In MacOS Terminal, let’s install Grafana on our Ubuntu virtual machine and work on our data visualization.
Add the repository to Ubuntu:
sudo apt-get install -y apt-transport-https
sudo apt-get install -y software-properties-common wget
wget -q -O - https://packages.grafana.com/gpg.key | sudo apt-key add -
echo "deb https://packages.grafana.com/oss/deb stable main" | sudo tee -a /etc/apt/sources.list.d/grafana.list
After you add the repository:
sudo apt-get update
sudo apt-get install grafana
Enable Grafana so it will start on reboot and start the service.
sudo systemctl enable grafana-server
sudo systemctl start grafana-server
Check the status of Grafana:
sudo systemctl status grafana-serverFinally, open the port so we can reach the Grafana dashboard.
sudo ufw allow 3000/tcpAccess the Grafana control panel by entering your Ubuntu IP address with port 3000 in your web browser. For example, I use http://192.168.2.144:3000.
The default username is admin. The default password is admin.
Change the password.
You’re in!
Step 8. Configure Grafana
The first thing we need to do in Grafana is add InfluxDB as a Data Source.
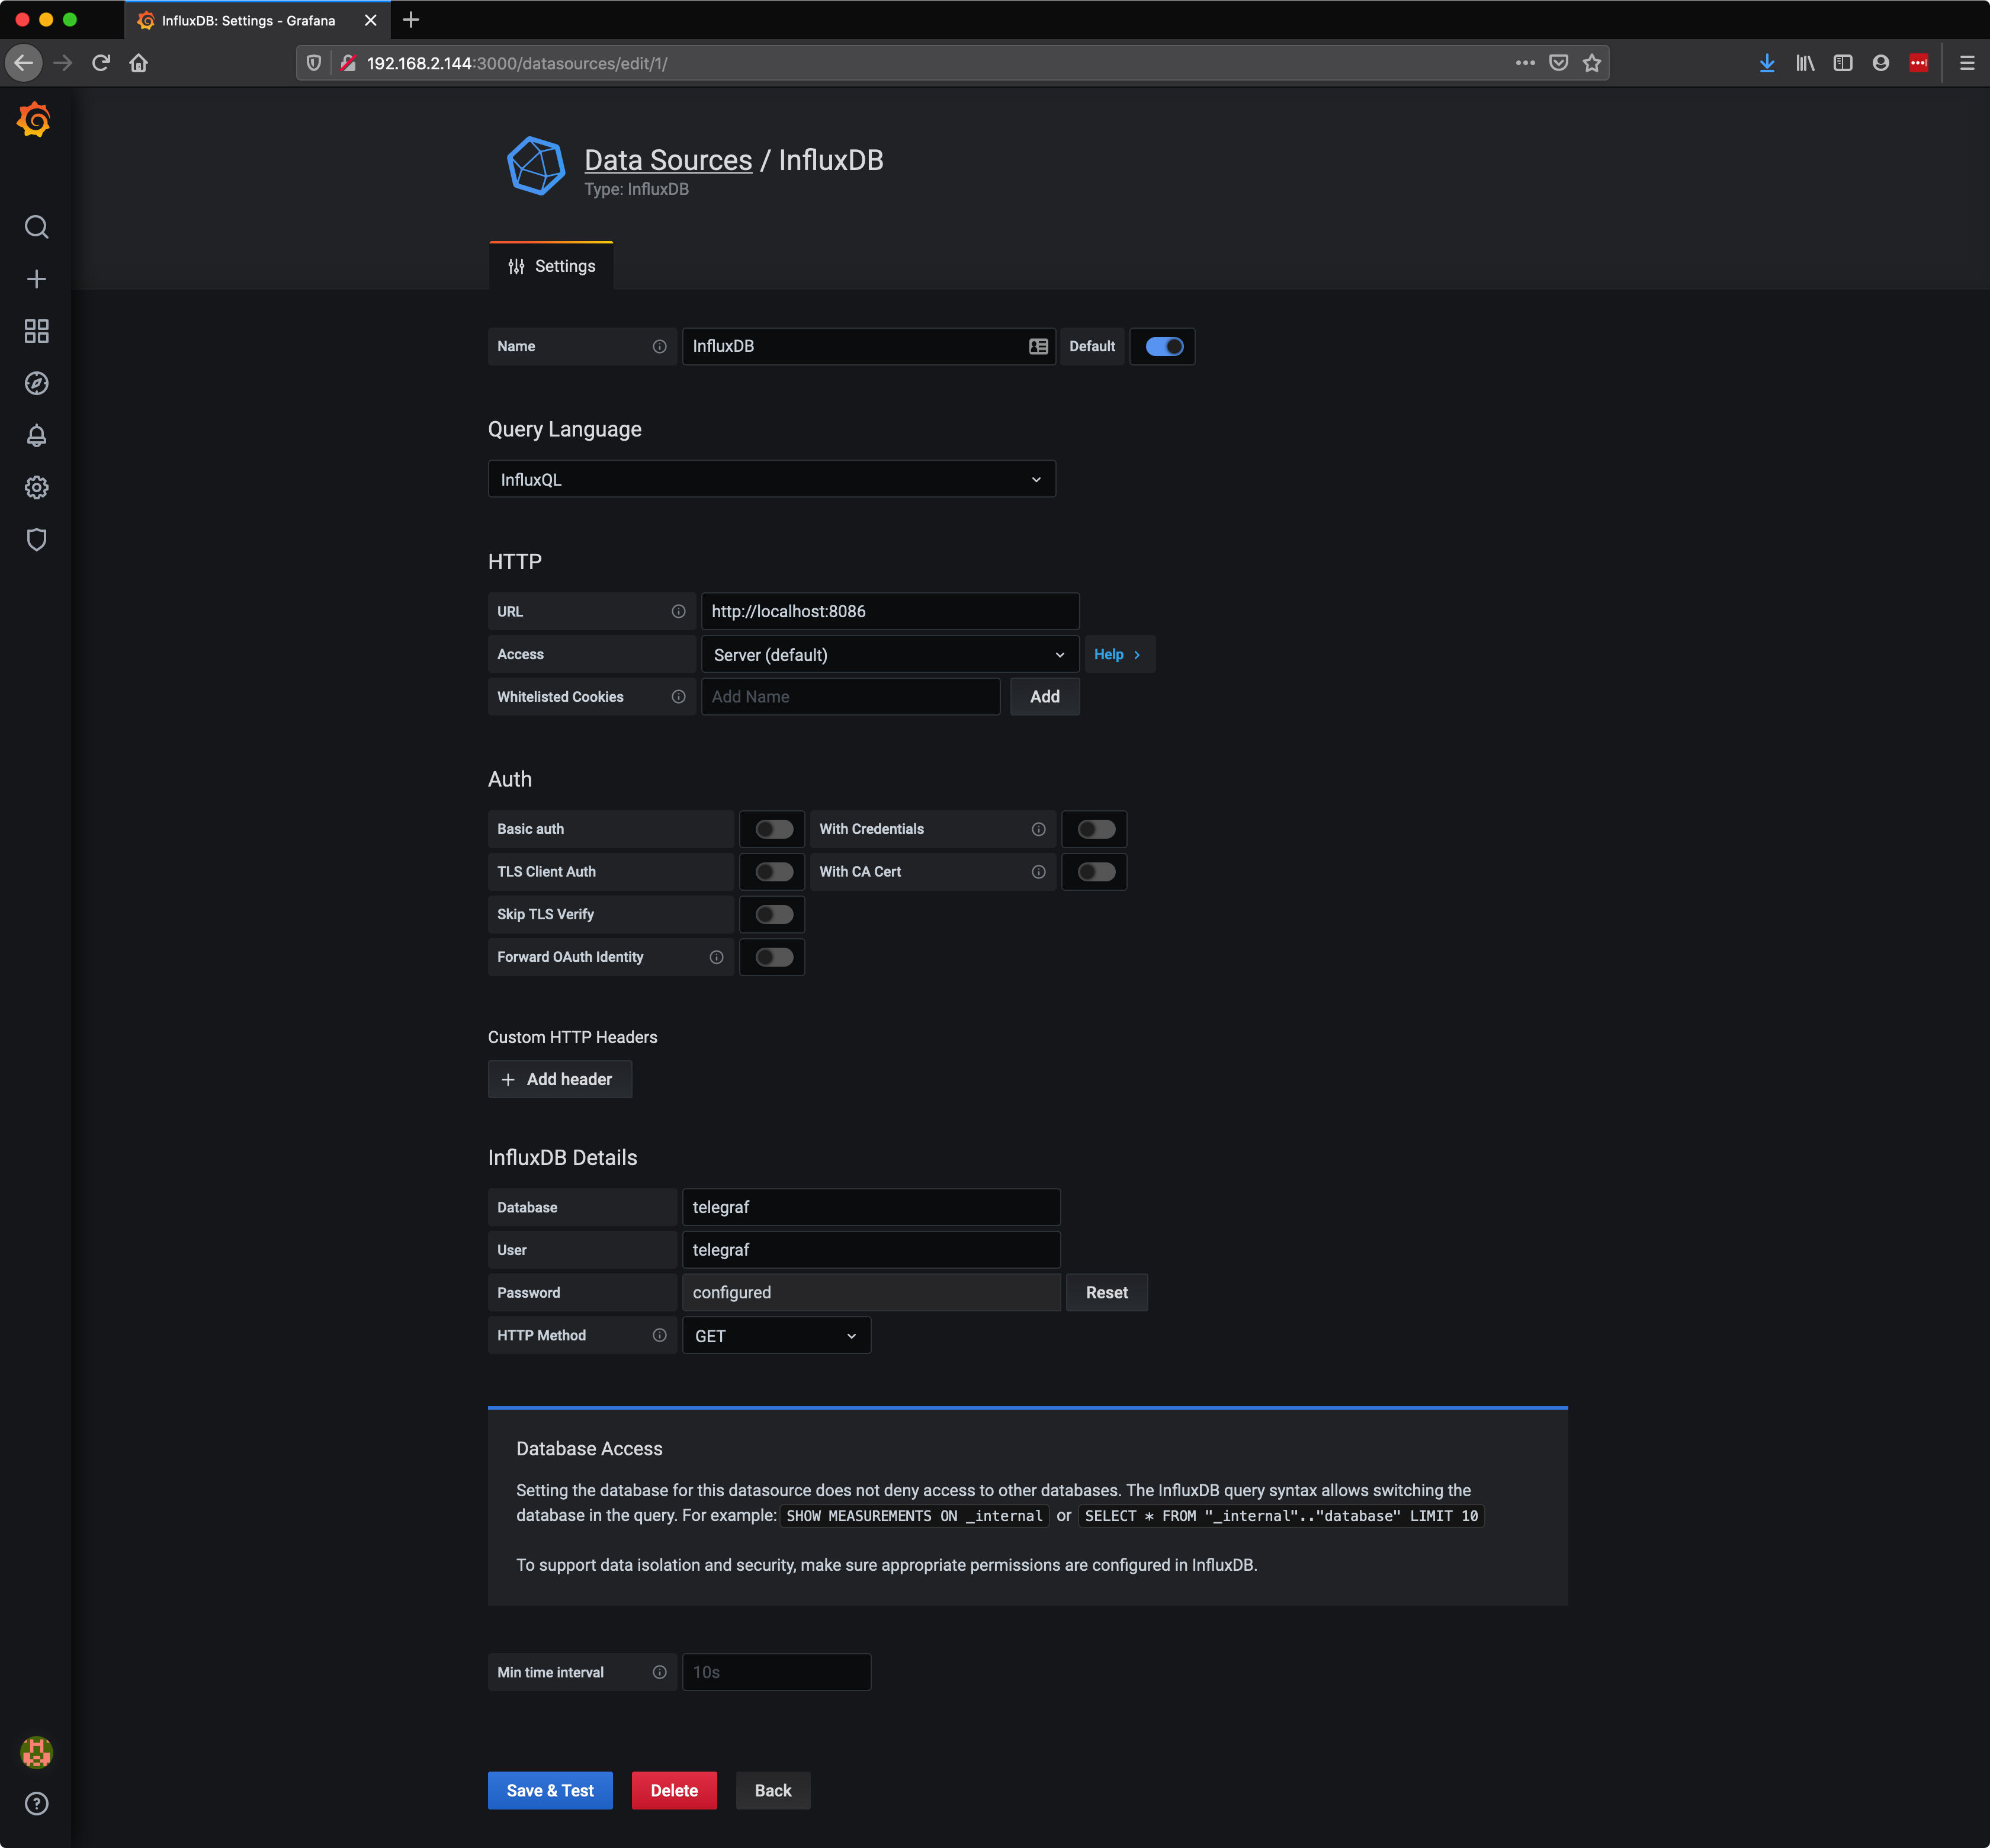
Navigate the left menu to Configuration > Data Sources. Click Add Data Source. Choose InfluxDB.
Add the URL http://localhost:8086 to the HTTP section. Add your database name, username and password to the InfluxDB section. Select GET for the HTTP Method.
Now we are ready to build our first Dashboard.
Let’s start with something very simple like system uptime. Create a new dashboard and click the “Add new panel” button. In the panel editor choose the following settings in the query editor:
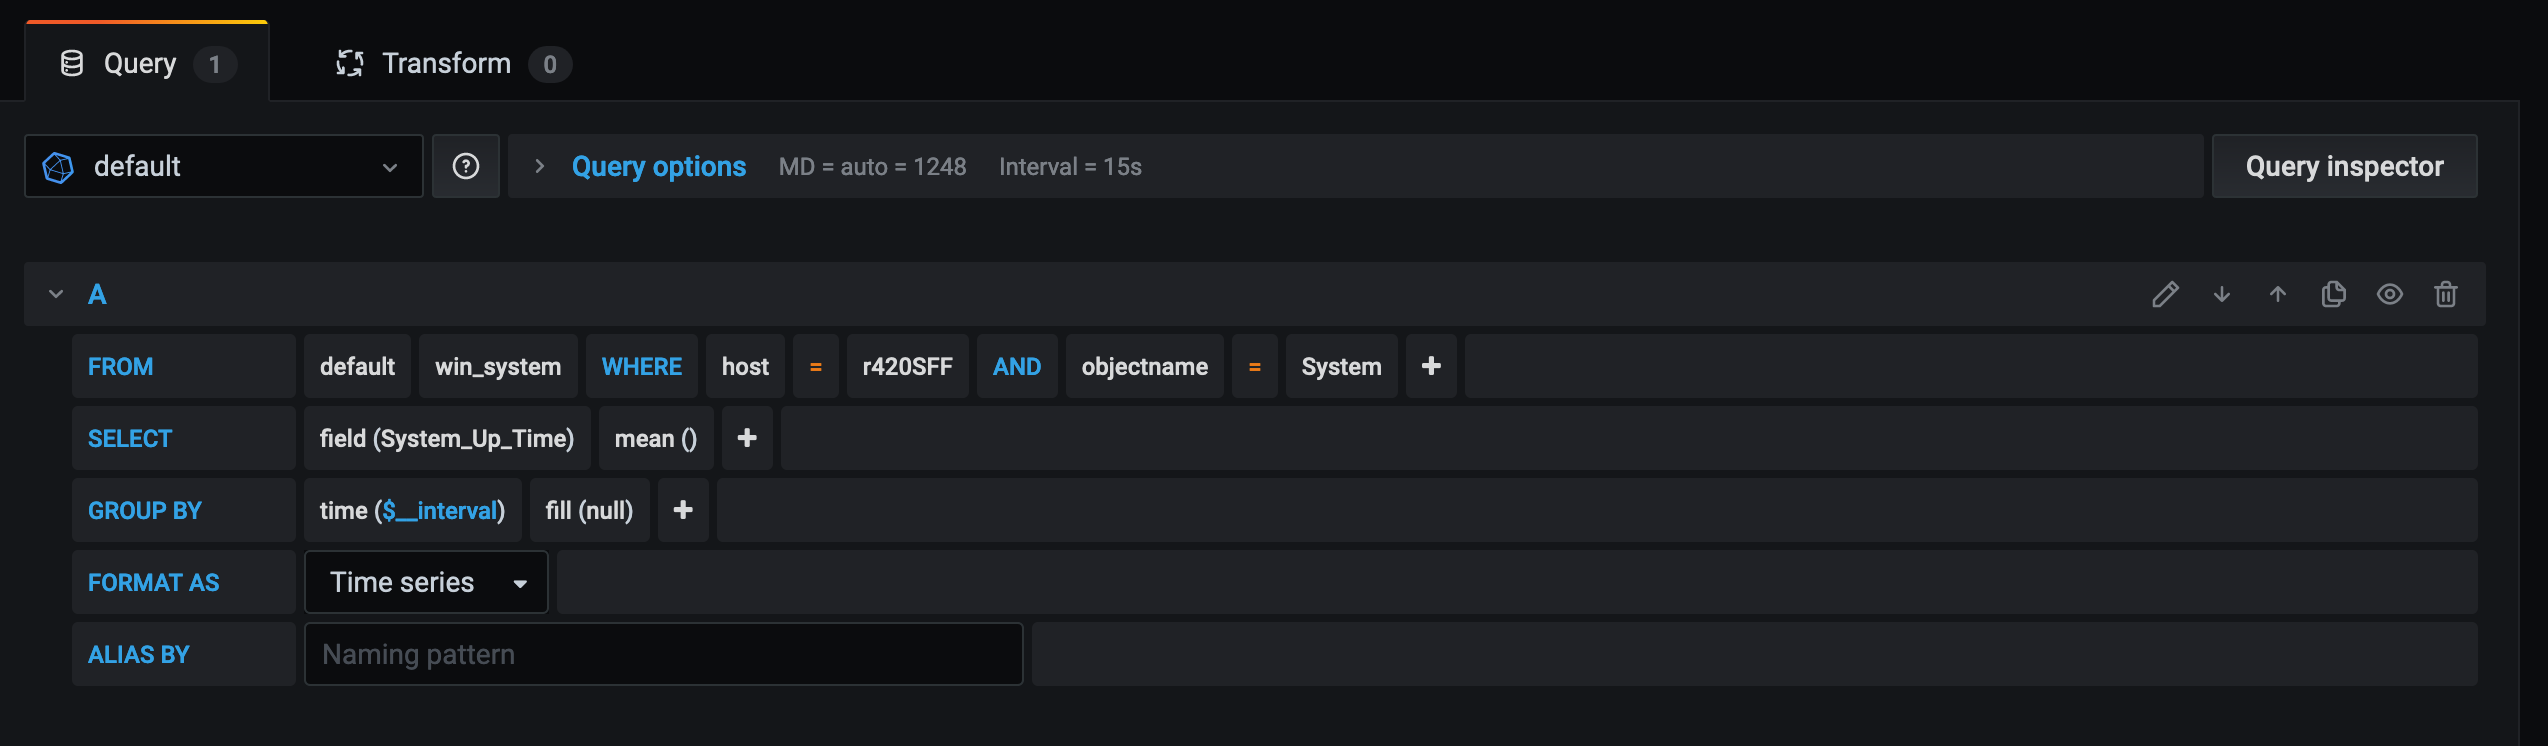
Choose Stat for the visualization of the panel. Under the Filed tab, select seconds for the Unit of measure.
That’s it, you have your first panel on the dashboard.

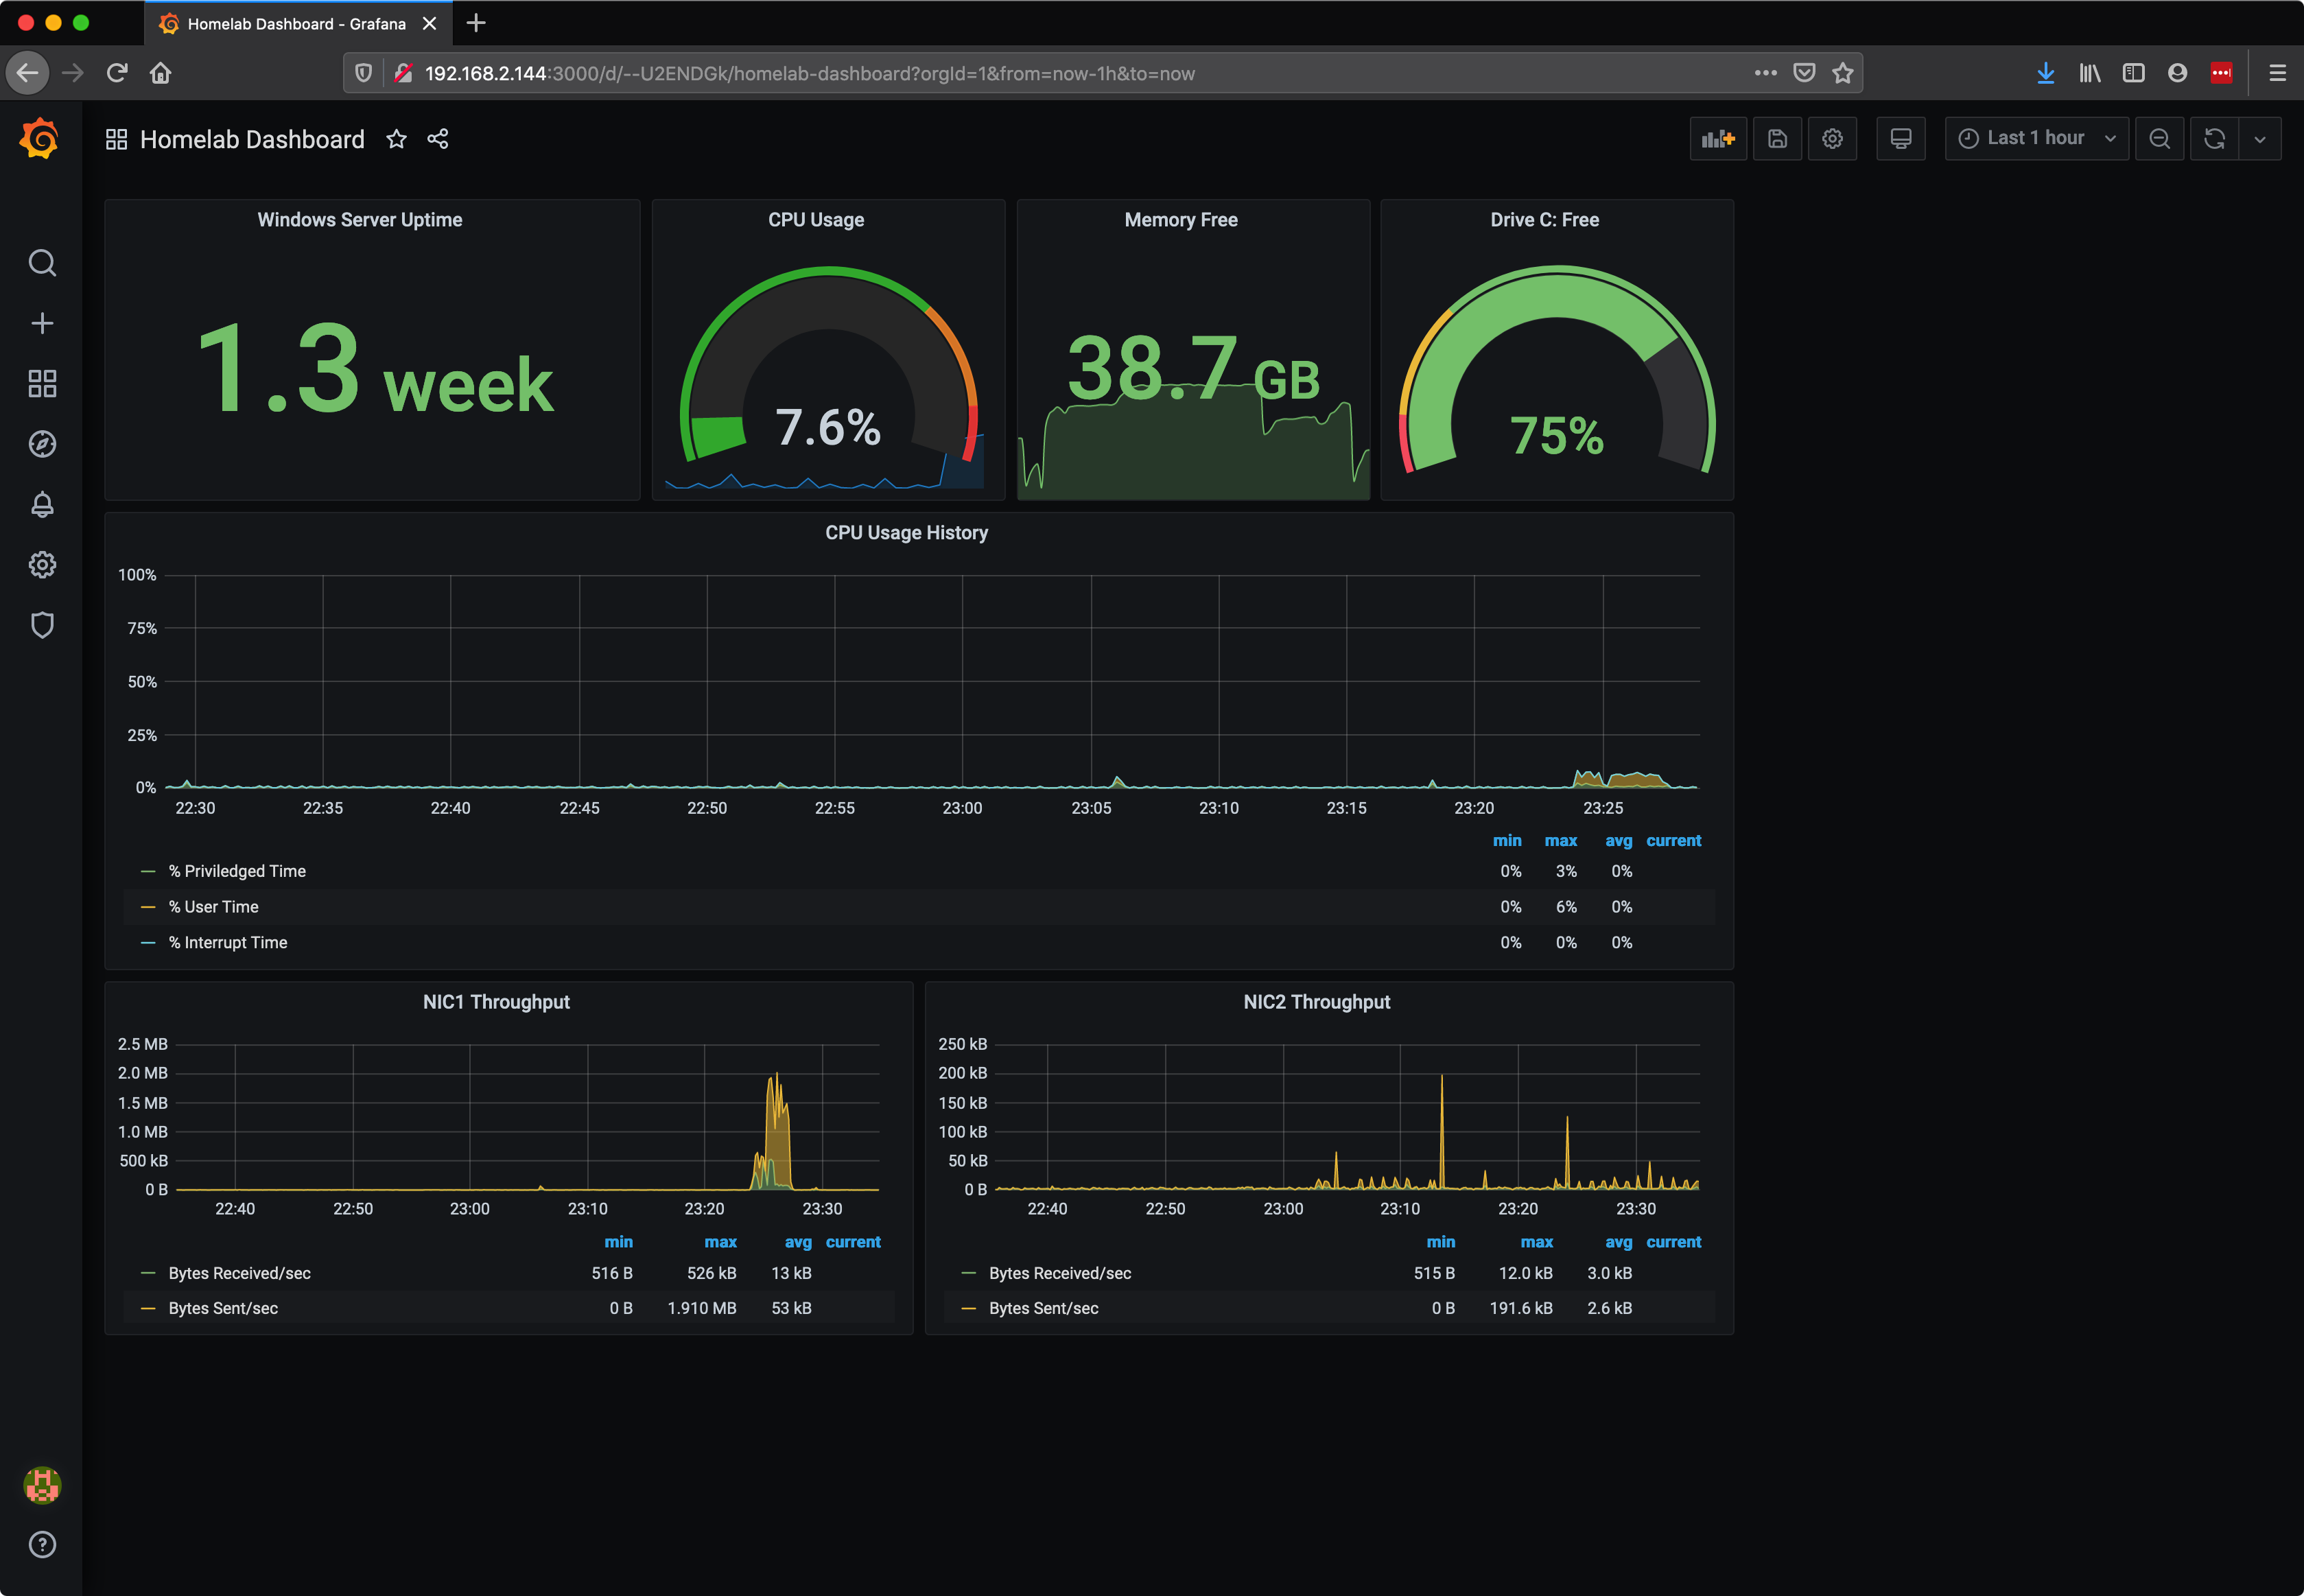
From here, the sky is the limit! Use the measurements in your query editor to discover all of the data you can display from the server.
You can see below a few more panels have been added for CPU usage, Memory, Network Throughput, etc.
Next Steps
The next step is to start installing Telegraf on virtual machines or other services like Unraid in your homelab and send that data to your InfluxDB. You can create new databases in InfluxDB or just send it all to the the same database and sort it out by the hostname when you add panels to your dashboard in Grafana.
One reply on “How To Create A Grafana Dashboard for Your Homelab”
[…] a previous post I walked through how to setup Grafana for your homelab. Grafana and InfluxDB are installed on a […]